
Figures & data
Table 1 Baseline Characteristics of 90 Patients Admitted to an Internal Medicine Ward for COVID-19
Figure 1 Risk groups’ comparison between NRS-2002 and BIA parameters. The percentage of the group found to be at risk varied significantly between NRS-2002, PhA, FFM, FM and BCM (p < 0.001).
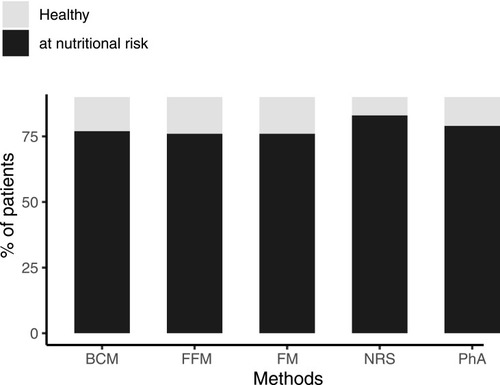
Table 2 Body Composition and Nutritional Risk Screening According to Outcomes Under Study
Table 3 ROC Curves in Predicting Clinical Outcomes, Prolonged Hospitalization and Loss of Appetite According to NRS and Bioimpedance Parameters
Table 4 Linear Regression Exploring the Correlation Between NRS-2002, Bioimpedance Parameters and Length of Hospitalization
Table 5 Multivariate Regression Analysis of NRS and Bioimpedance Parameters for Clinical Outcomes in Patients with COVID-19