Figures & data
Table 1 Basic Clinical Characteristics of CIN (+) Group and CIN (−) Group
Figure 1 Numbers and percentages of CIN (+) and CIN (−) groups according to baseline sST2 cut-off value of >35 ng/mL.
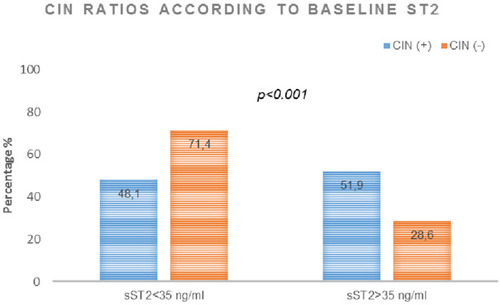
Table 2 Multivariate Logistic Regression Analysis for Potential Predictors of Contrast-Induced Nephropathy
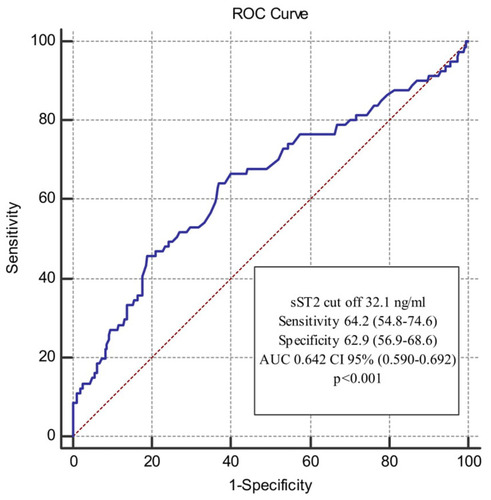
Figure 2 Receiver operating characteristics curve showing the distinguishing ability of soluble ST2 level for contrast-induced nephropathy.
Abbreviations: AUC, area under the ROC curve; CI, confidence interval; ROC, receiver operating characteristics.