Figures & data
Table 1 Clinical and Echocardiographic Characteristics of Study Population
Figure 1 Body mass index and sex distribution among the 3 categories of heart failure. BMI comparison – Kruskal–Wallis test (P<0.001). Sex comparison – Chi-square test (P<0.001).
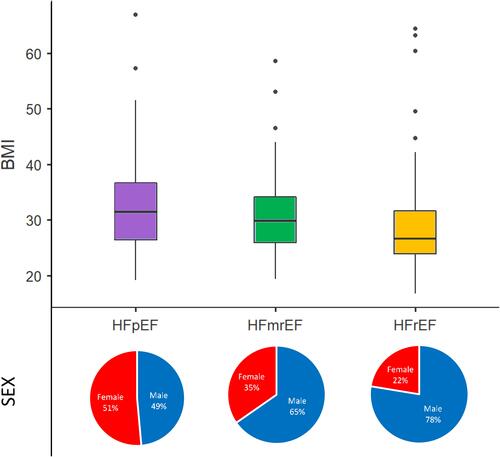
Table 2 Pharmacological Management of Study Population
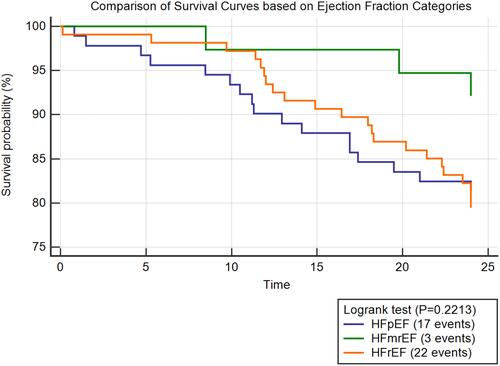
Figure 2 Kaplan–Meier survival analysis in patient’s population based on ejection fraction.
Abbreviations: HFpEF, heart failure with preserved ejection fraction; HFmrEF, heart failure with mid-range ejection fraction; HFrEF, heart failure with reduced ejection fraction.