Figures & data
Figure 1 Time windows for data collection.
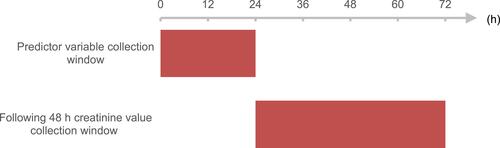
Figure 2 Handling and splitting of imbalanced data.
Notes: (A) Imbalanced cohort with more non-AKI patients than AKI patients. (B) Balanced cohort with the same number of AKI and non-AKI patients. (C) Resorting of the sequence randomly. (D) Randomly selected 20% from c as the testing set. (E) Random selection of 20% from c as the training set.
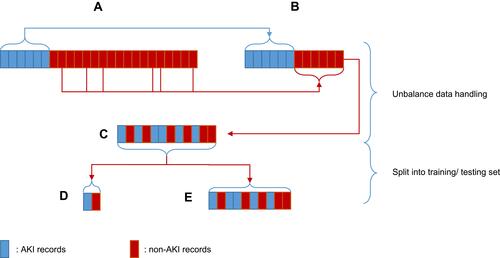
Table 1 Demographic Characteristics of the Patient Cohort at Baseline
Table 2 Statistic Summary of the 10-Times AUC Result for Each Model
Table 3 ANOVA of the 10-Times AUC Result for Each Model
Table 4 Predictive Models Results
Table 5 Studies on Predicting Acute Kidney Injury in ICU
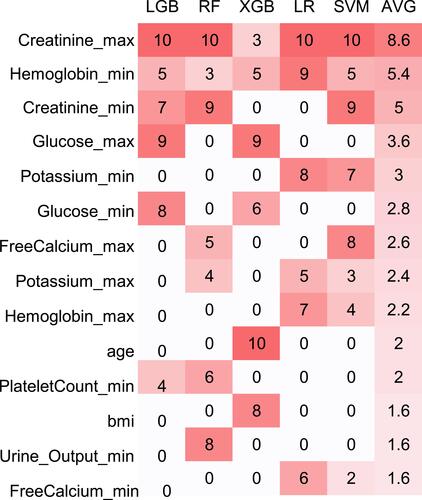
Figure 3 The importance of each feature in each model.
Abbreviations: LGB, Light Gradient Boosting Decision; RF, random forest; XGB, eXtreme Gradient Boosting; LR, logistic regression; SVM, supported vector machine; AVG, average.