
Figures & data
Figure 1 FPL plate distance. It is defined as the distance between the distal edge of the plate and the FPL tendon.
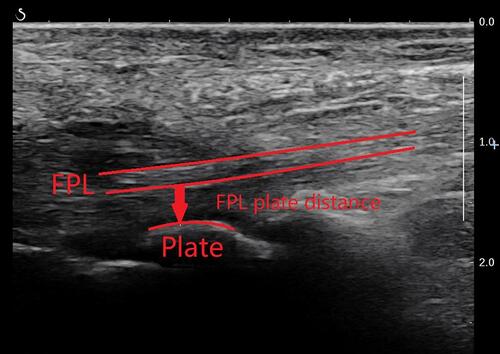
Figure 2 FPL tissue rigidity was assessed by SWE, the mean Young’s modulus was 43.7 kPa, and the color of ROI was blue, which means the rigidity of FPL was soft.
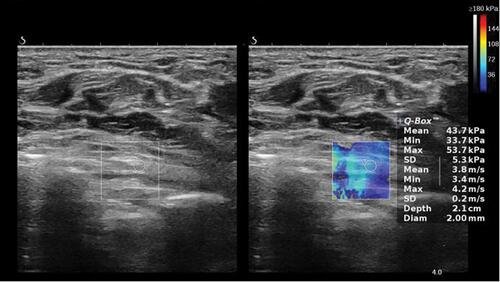
Figure 3 FPL tissue rigidity was assessed by SWE, the mean Young’s modulus was 70.9 kPa, and the color of ROI was yellow, which means the rigidity of FPL was intermediate.
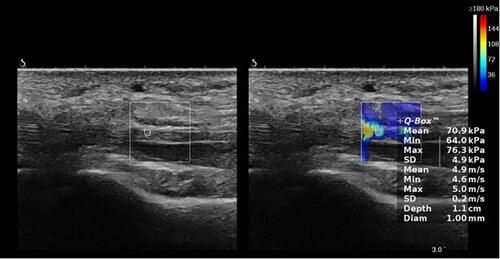
Figure 4 FPL tissue rigidity was assessed by SWE, the mean Young’s modulus was 287.9 kPa, and the color of ROI was red, which means the rigidity of FPL was hard.
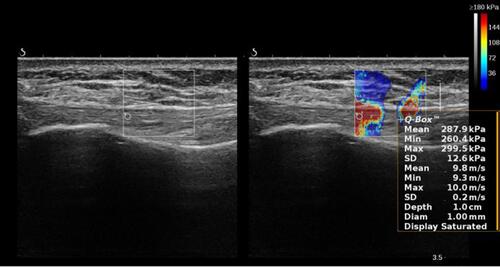
Table 1 Correlation Between SWE Involved Wrist and Parameters