Figures & data
Table 1 Comparison of Gender and Age Between Children with Chronic ITP and Children with Non-Chronic ITP
Table 2 Comparison of the Degree of Bleeding and the Course of the Initial Diagnosis Between Children with Chronic ITP and Children with Non-Chronic ITP
Table 3 Comparison of PLT Antibodies, PLT Counts and Newly Diagnosed Megakaryocytes in Children with Chronic ITP and Non-Chronic ITP Children
Table 4 Comparison of Cytomegalovirus Infection and Newly Diagnosed ALC in Children with Chronic ITP and Non-Chronic ITP Children
Table 5 Comparison of Treatment Methods Between Children with Chronic ITP and Children with Non-Chronic ITP
Table 6 The Relationship Between Age, First-Diagnosed Disease Course and First-Diagnosed ALC and Chronic ITP
Figure 1 The area under the curve for the first diagnosed ALC to predict ITP.
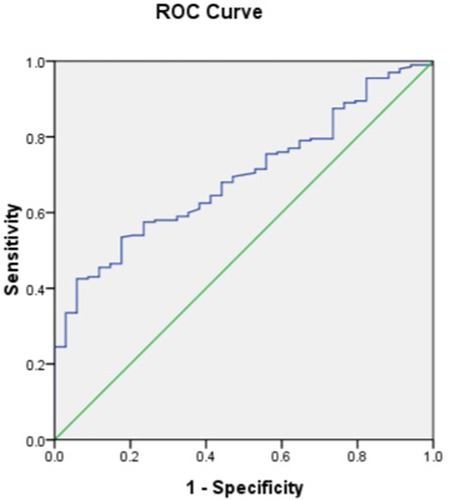
Table 7 EPQ Psychological Evaluation Analysis of Children with Chronic ITP and Normal Children
Figure 2 EPQ psychological evaluation of children with chronic ITP and normal children (***p<0.05).
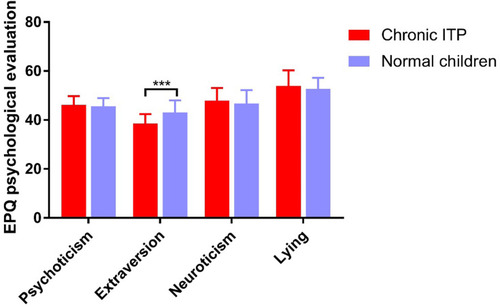
Table 8 EPQ Psychological Evaluation of Children with Chronic ITP and Newly Diagnosed Children with ITP
Figure 3 EPQ psychological evaluation of children with chronic ITP and newly diagnosed children with ITP (**p<0.05, *p<0.05).
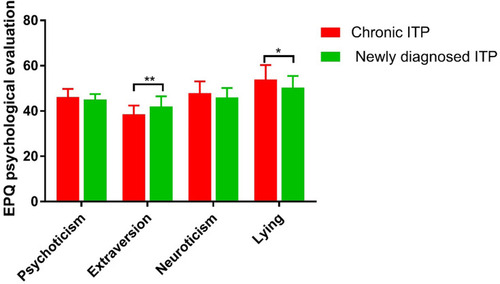
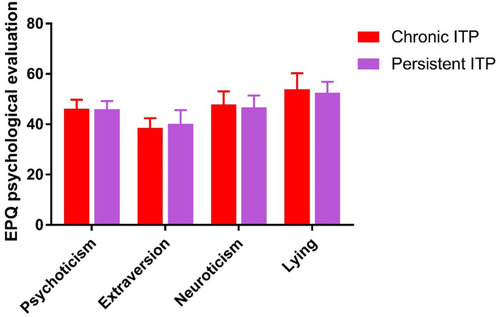
Table 9 EPQ Psychological Evaluation of Children with Chronic ITP and Children with Persistent ITP
Figure 4 EPQ psychological evaluation of children with chronic ITP and children with persistent ITP.