
Figures & data
Table 1 Demographic Data, Symptom Score, Blood Tests, Chest Radiography, and Echocardiography (n = 46)
Table 2 Lung Function
Table 3 Cardiopulmonary Physiological Data, Arterial Blood Gases, Carboxyhemoglobin and Plasma Lactate Concentrations at Rest
Figure 1 Flow diagram. A total of 57 subjects with chronic obstructive pulmonary disease were screened. After excluding 10 subjects, the remaining 46 were retained for analysis after further excluding another one subject whose arterial blood gas data was not obtained.
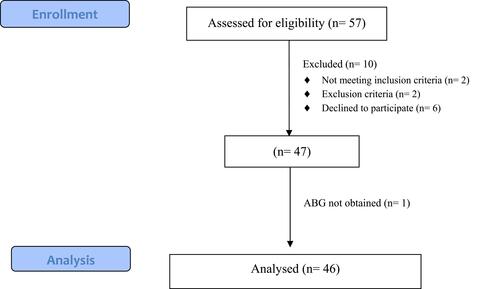
Table 4 Comparison of Correlation Coefficient (r) Between Resting Dead Space Fraction (VD/VTR) and Lung Function with Variables of Interest
Table 5 Risk Factors of Dead Space Fraction at Rest (VD/VTR)