
Figures & data
Table 1 Comparison of General Situations Among Three Groups of Puerperant
Figure 1 VAS score distribution of three groups before analgesia.
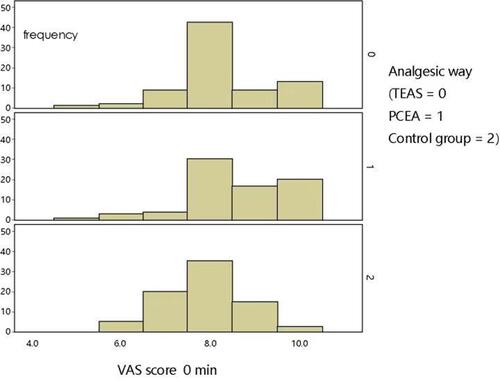
Figure 2 Comparison of VAS scores before analgesia and at each time point after analgesia: Analysis of variance of repeated measurements at different time points after analgesia among the three groups reveal that, after the implementation of analgesia, there are significant differences among different analgesia methods (Fgroup = 331.261, P = 0.000); the VAS score is significantly lower in the TEAS group and PCEA group than in the control group (P = 0.000; P = 0.000).
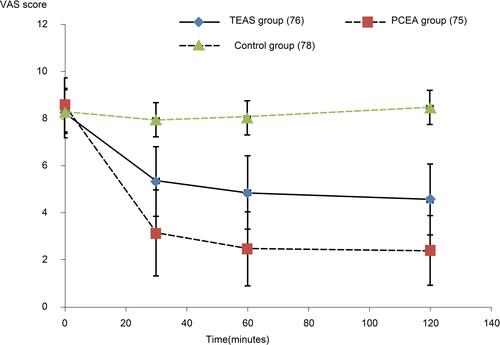
Figure 3 Comparison of β-endorphin content in three groups immediately before analgesia and at 120 minutes after analgesia: Comparison of the difference in endorphin content among the three groups at 120 minutes after analgesia and immediately before analgesia F = 13.630, P = 0.000.
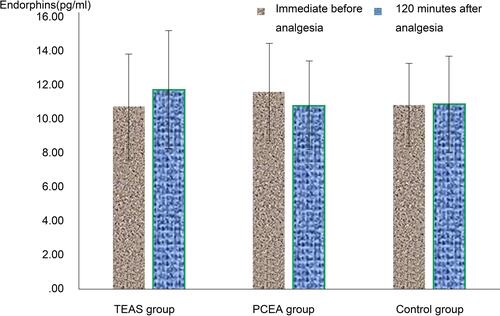
Figure 4 Comparison of the duration of of vaginal delivery among the three groups: Comparison of the duration of the first stage of labor: the duration of the first stage of labor is significantly shorter in the TEAS group and control group than in the PCEA group (P<0.01, P<0.01). Comparison of the duration of the second stage of labor: the duration of the second stage of labor is significantly shorter in the TEAS group than in the PCEA group (P<0.01).
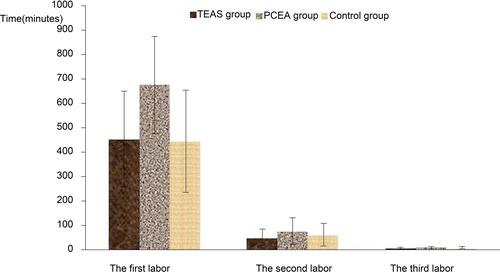
Figure 5 Comparison of oxytocin use rate of three groups after analgesia: Comparison of oxytocin use rate of three groups after analgesia: The use rate is significantly lower in the TEAS group and control group than in the PCEA group (P = 0.000, P < 0.01, P = 0.000, P < 0.01).
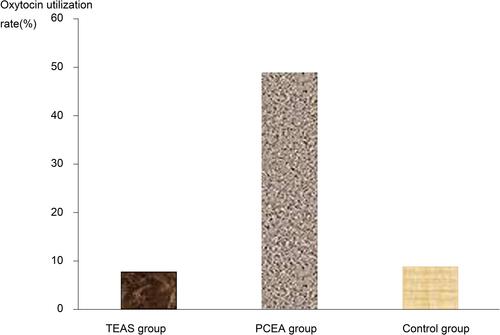
Figure 6 Comparison of the incidence of adverse reactions after analgesia among three groups: Oxytocin use rate after analgesia is significantly lower in the TEAS group and control group than in the PCEA group (P = 0.000, P < 0.01, P = 0.000, P < 0.01).
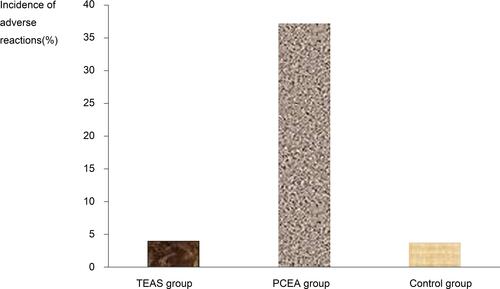
Table 2 Comparison of Cesarean Section Rate Among Three Groups of Puerperant (Cases [%])
Table 3 Comparison of the Bleeding Volume After Vaginal Delivery Under Analgesia and Neonatal Apgar Score at 1 Minute and 5 Minutes After Analgesia Among the Three Groups of Puerperant