Figures & data
Figure 1 Participants enrollment flowchart including exclusion criteria-NHANES 2005–2014.

Table 1 Weighted Baseline Characteristics of the Study Population-NHANES 2005–2014
Figure 2 Adjusted dose–response association between BMI/WC and risk for CVD mortality in participants with (A) and without (B) depression. Y-axis represents the adjusted hazard ratio of CVD mortality for a given BMI/WC value compared with a referent level of 5th percentile of its distribution. The model was adjusted for age, sex, race/ethnicity, education and poverty income ratio.
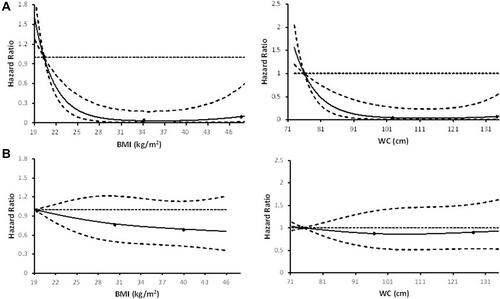
Figure 3 Multivariable-adjusted hazard ratio for CVD mortality by statuses of depression and each of the 14 common risk factors. The model was adjusted for age, sex, race/ethnicity, education, poverty income ratio, smoking, alcohol use, activity, BMI, period, congestive heart failure, coronary heart disease, angina, angina pectoris, heart attack, diabetes, high blood pressure or hypertension, cancer or malignancy of any kind, and stroke.
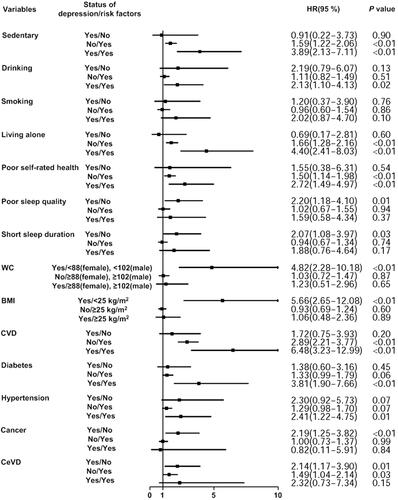
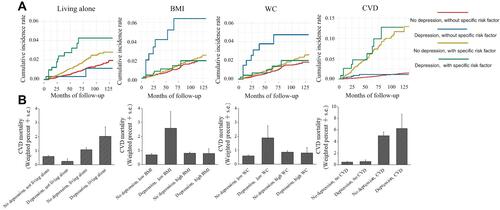
Figure 4 Survival curves (A) and weighted CVD mortality (B) by statuses of depression and living alone, BMI, WC or baseline CVD.