Figures & data
Table 1 Comparison of Lordosis (A) and Kyphosis (B) Groups
Figure 1 A 42-year-old female patient. (A) It shows the patient is allocated to the lumbar lordosis group before the operation. (B) Single segmental PSO surgery is performed at L1. The LL and SVA change to −59° and 38.26 mm from −24° and 148.73 mm, respectively. (C) During the follow-up, no obvious correction loss is observed in the final year.
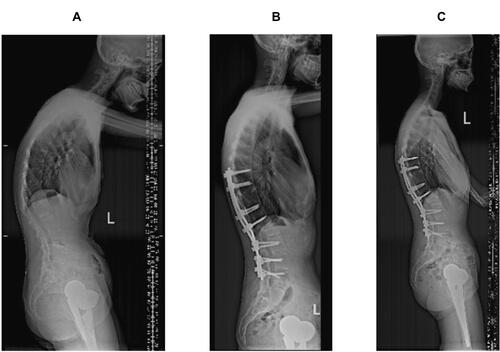
Figure 2 A 49-year-old male patient. (A) It shows the disease is located at the apex of T11–12 before the operation, and the patient is allocated to the lumbar kyphosis group. (B) Single segmental PSO surgery is performed at T12. The GK and SVA are corrected to 61° and 72.31 mm from 93° and 274.29 mm, respectively. (C) During the follow-up, the GK increases to 57, and the LL is improved to −56° from −28° in the final year. No obvious correction loss is observed.
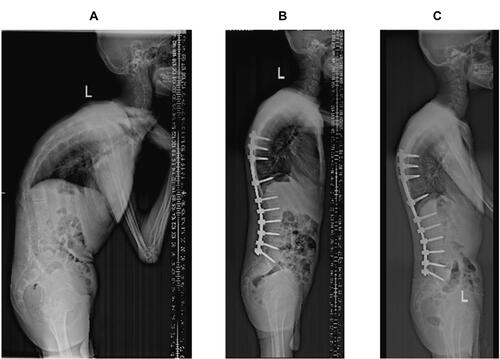
Figure 3 A 49-year-old male patient. (A) The patient is allocated to the lumbar kyphosis group before the operation. (B) Single segmental PSO surgery is performed at L2. The LL and SVA change to −56° and 63.06 mm from 8° and 312.84 mm, respectively (C). During the follow-up, no significant correction loss is observed in the final year. The LL and SVA are −56° and 70.35 mm, respectively.
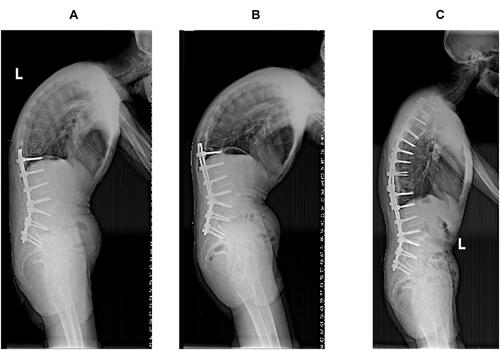
Figure 4 A 46-year-old female patient. (A) It shows the disease is located at the apex of L2–L3, and the patient is allocated to the lumbar kyphosis group. (B) The SPO osteotomy is performed at L1–L2, L4–L5, and L5–S1. The single segmental PSO osteotomy is performed at L3. The GK and SVA change to 59° and 56.36 mm from 103° and 261.49 mm, respectively. The LL is corrected to postoperative −44° from preoperative 41°. (C) During the follow-up, no significant correction loss is observed in the final year. The LL, GK, and SVA are −45°, 62°, and 48.82 mm, respectively.
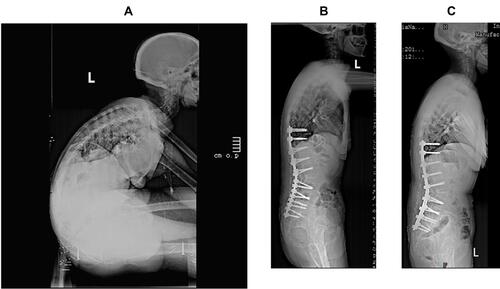
Table 2 Preoperative Comparison of Four Subgroups (T12, L1, L2 and L3)
Table 3 Efficacy Comparison of Four Subgroups (T12, L1, L2 and L3)
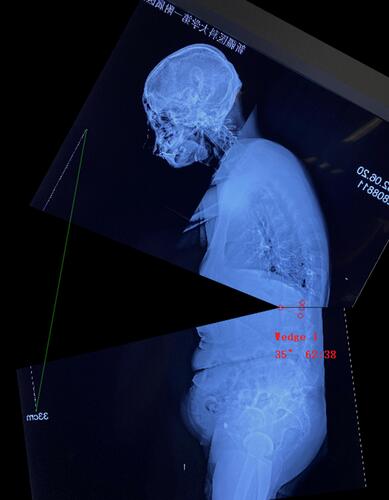
Figure 5 Simulated selection of osteotomy plane and PSO angle before operation. Simulated osteotomy angle = preoperative mandibular eyebrow angle + preoperative PT-tPT-10, tPT = 0.37 × PT-7.