Figures & data
Table 1 Patients’ Characteristics at Baseline
Table 2 Analysis of Risk Factors Associated with PFS in the Whole Population
Table 3 Analysis of PET Parameters Associated with PFS in Patients with De novo Stage IV
Figure 1 Kaplan–Meier curve of progression-free survival for all patients stratified by SUVmax (A), SUVmean (B), MTV (C), TLG (D) and HI (E).
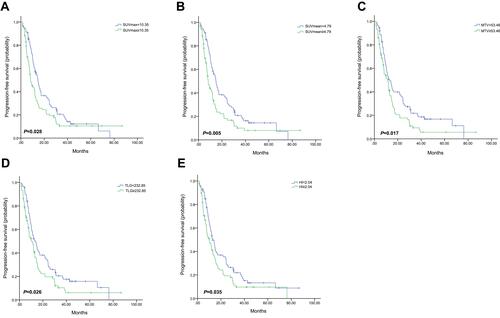
Figure 2 Kaplan–Meier curve of progression-free survival for patients with De novo stage IV stratified by HI.
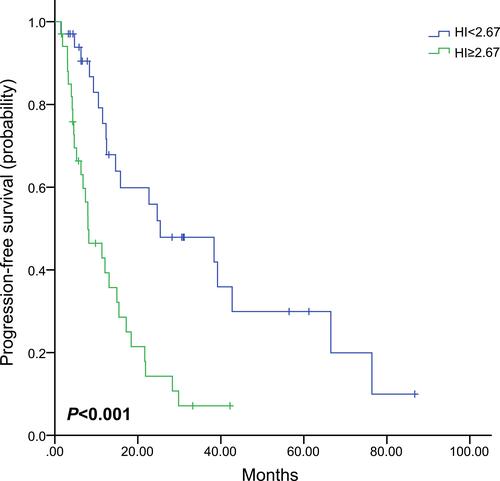
Table 4 Analysis of PET Parameters Associated with PFS in Patients with Different Molecular Subtypes
Figure 3 Kaplan–Meier curve of progression-free survival for HR+/HER2- patients stratified by HI.
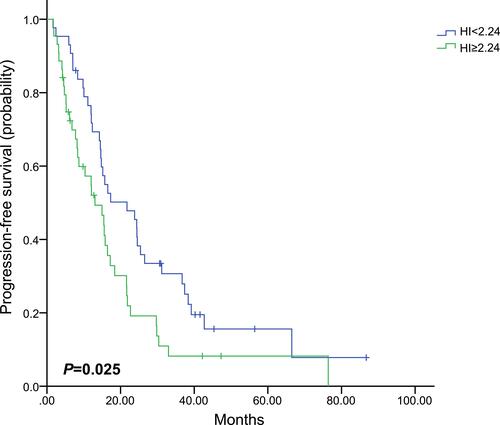
Figure 4 Kaplan–Meier curve of progression-free survival for HER2+ patients stratified by HI.
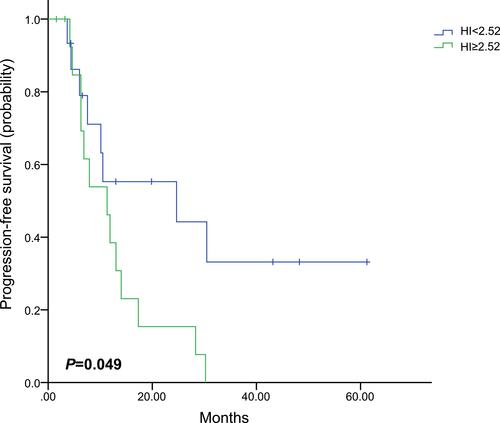
Figure 5 Kaplan–Meier curve of progression-free survival for triple-negative patients stratified by SUVmax (A), MTV (B) and TLG (C).
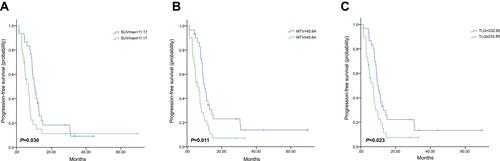
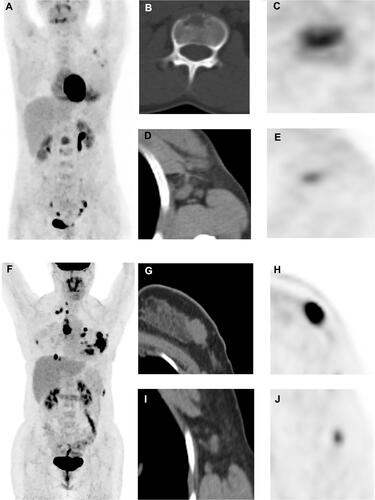
Figure 6 Representative images. (A–E): A 31‐year‐old female patient with HR+/HER2- MBC underwent PET/CT scan (A, maximum intensity projection image). We detected that the first lumbar vertebra lesion had the highest 18F‐FDG uptake in all metastatic lesions (B, CT image; C, PET image, SUVmax were 5.43), whereas the right axillary lymph node lesion had the lowest uptake (D, CT image; E, PET image, minimum FDG uptake across all lesions = 3.58). Therefore, HI of this patient was 1.52, and she had a median PFS of 57.4 months. (F–J): A 30‐year‐old female patient with HR+/HER2- MBC underwent 18F‐FDG PET/CT scan (F, maximum intensity projection image). We detected that the chest wall lesion had the highest 18F‐FDG uptake in all metastatic lesions (G, CT image; H, PET image, SUVmax = 15.71), whereas right axillary lymph node lesion had the lowest uptake (I, CT image; J, PET image, minimum FDG uptake = 3.79); Therefore, HI of this patient was 4.15, and she had a PFS of 5.2 months.