
Figures & data
Figure 1 Flow chart of the eligible nonsmoking individuals and applied methodology in the study population.
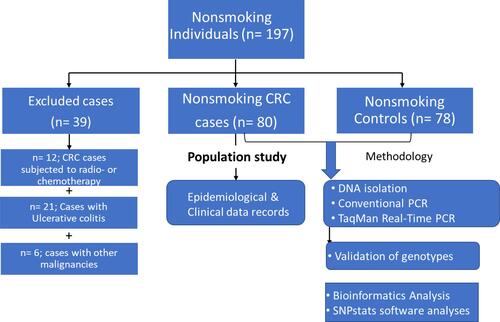
Figure 2 A schematic histogram showing the distribution of CRC cases (n = 80) according to their age groups. A maximum frequency of 35.7% is found at the 71–80 years age group. The young age group (40–50 years) showed a frequency of 28.6%.
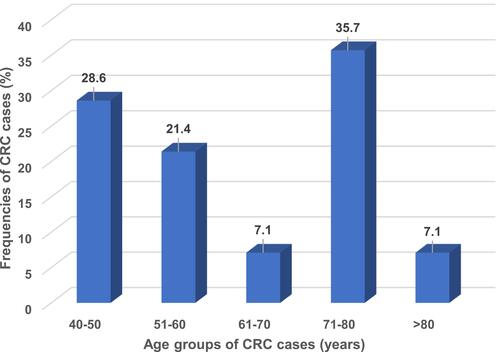
Table 1 Allele Frequencies of the Examined SNPs in CRC Cases and Controls
Table 2 Genotype Distributions of the Examined SNPs in CRC Cases and Healthy Controls (Adjusted by Gender)
Figure 3 Gene-network interactions contained the CYP1A1, GSTM1, and TP53 genes examined in this study (left side) created with STRING (https://string-db.org/). On the Right side: More extended genes, namely, CREBBP, EP300, MDM2, ATM, and BCL2L1 genes, strongly interacted with the TP53 genes. Each node represents all the proteins produced by a single, protein-coding gene locus. Colored nodes describe proteins and the first shell of interactors. Edges represent protein-protein associations that are meant to be specific and meaningful, ie, proteins jointly contribute to a shared function; this does not necessarily mean they are physically binding each other.
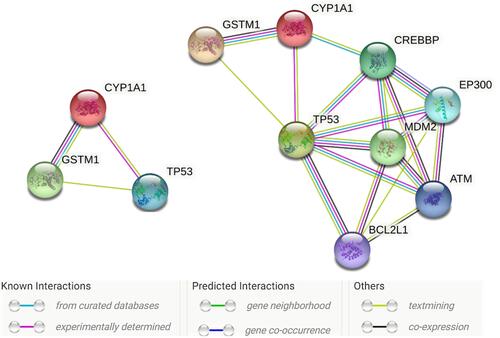
Table 3 Coefficients of Linkage Disequilibrium (LD) Among the GSTM1, GSTT1, CYP450 (rs4646903 and rs1048943), and TP53 rs1042522 SNPs
Table 4 In-silico Functional Predictions of Non-Synonymous SNPs