Figures & data
Figure 1 Flow diagram of training, validation, and testing of the prediction models.
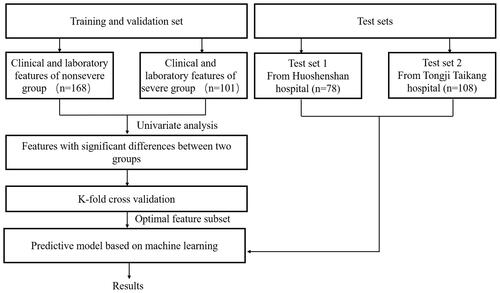
Table 1 Demographic and clinical characteristics of COVID–19 patients in training and validation sets
Table 2 Optimal-feature subset of each machine learning method
Table 3 Comparison of the average predictive performance by k-fold cross-validation with optimal-feature subset
Figure 2 ROC curves for models in training and validation sets. (A) ROC curves of LR subsets for distinguishing between severe and nonsevere patients. AUC of optimal-feature subset 0.937 (95% CI 0.902–0.927), all features 0.916 (95% CI 0.876–0.955), and single optimal feature (D-dimer) 0.837 (95% CI 0.786–0.887). (B) ROC curves for subsets of features from KNN for distinguishing between severe and nonsevere patients. AUC of the optimal feature subset 0.948 (95% CI 0.924–0.937), all features 0.935 (95% CI 0.907–0.963), and single optimal feature (D-dimer) 0.835 (95% CI 0.782–0.887). (C) ROC curves of subsets of features from NB for distinguishing between severe and nonsevere patients. AUC of optimal feature set 0.935 (95% CI 0.906–0.964), all features 0.916 (95% CI 0.879–0.954), and single optimal feature (D-dimer) 0.805 (95% CI 0.748–0.861). (D) ROC curves of subsets of features from SVM for distinguishing between severe and nonsevere patients. AUC of optimal feature subset 0.931 (95% CI 0.895–0.967), features 0.918 (95% CI 0.879–0.957), and single optimal feature (D-dimer) 0.832 (95% CI 0.781–0.884).
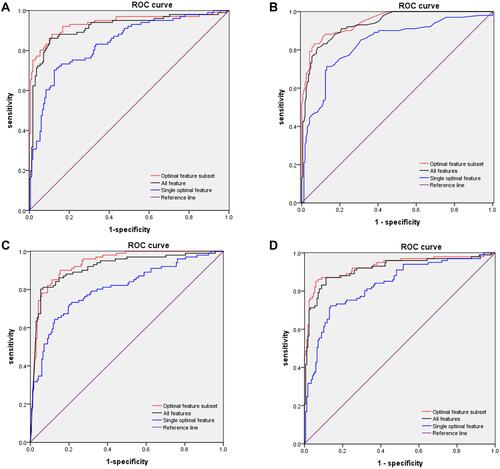
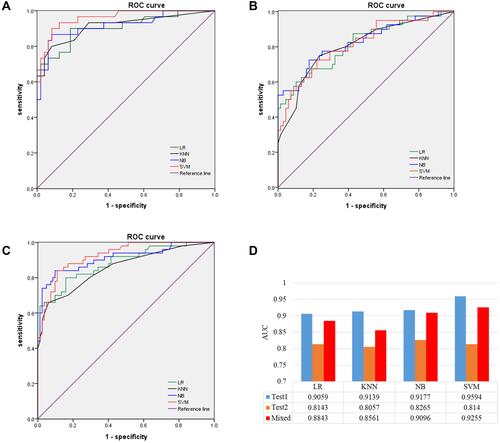
Figure 3 ROC curves of models in testing sets. (A) Optimal-feature set of LR, KNN, NB, and SVM in test set 1. (B) Optimal feature set of LR, KNN, NB, and SVM in test 2. (C) Optimal-feature set of LR, KNN, NB, and SVM in the mixed test sets. (D) AUC values of optimal-feature subsets for different models in test set 1, test set 2, and mixed test set.