
Figures & data
Table 1 Demographic and Clinical Data of SCI Patients
Table 2 Z-Score of Femoral Neck and Total Hip in SCI Patients
Figure 1 Comparison of BMDs at the DF, PT, and hip between SCI patients and healthy controls. (A) Comparison of BMDs between All SCI patients (n=36) and the controls; (B) Comparison of BMDs between SCI patients within 6 weeks post-injury (n=15) and the controls; (C) Comparison of BMDs between SCI patients during 6 weeks–3months post-injury (n=10) and the controls; (D) Comparison of BMDs between SCI patients during 3–12months post-injury (n=11) and the controls. *P<0.05, **P<0.01, ***P<0.001, independent sample t-test.
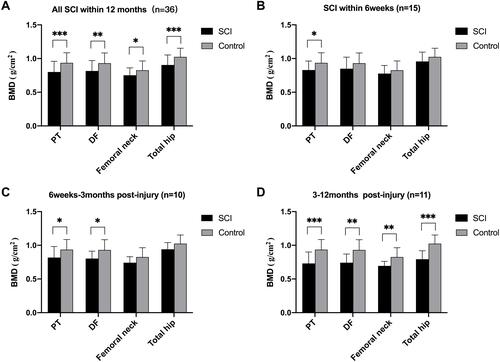
Table 3 Longitudinal Comparison of BMDs at the DF, PT, and Hip in Eight SCI Patients
Table 4 Correlations Between Clinical Indicators and BMDs at the DF and PT
Table 5 Multiple Linear Regression Analysis of BMDs at the DF and PT
Table 6 Comparison of BMD Between Complete Lesion and Incomplete Lesion Groups