Figures & data
Table 1 Clinical Characteristics of Adult ITP
Figure 1 The percentage of Tc increased in chronic ITP.
Notes: (A–B) In the flow gating strategy, lymphocytes were first gated by forward scattering FSC and side scattering SSC, and then cells were stained for live cells, lymphocytes were gated by CD45, T lymphocytes were circled by CD3 and CD8 simultaneously in (A). Representative of IFN-γ, IL-4 and IL-17 expression on CD3+CD8+ T subsets was shown in (B). Cells are defined as follows: Tc1: CD3+CD8+IFNγ+, Tc2:CD3+CD8+IL4+, Tc17: CD3+CD8+IL17+. (C) The rate of CD4+/CD8+ in healthy control and different course (1.20±0.10 control vs 0.89±0.37 nITP,1.60±1.23 pITP and 0.94±0.51 cITP, respectively, p = 0.38). (D) The rate of CD4+/CD8+ was no significant difference between PLT<50x109/L and PLT>50x109/L group (0.89±0.27 vs 0.85±0.55, p=0.88). (E) The percentage of Tc1 in cITP was greatly higher than nITP and healthy controls (33.98 ± 17.17 vs 7.76 ± 6.81, p < 0.05; 33.98 ± 17.17 vs 12.61 ± 5.14, p < 0.01). (F) There was no significant difference in Tc1 between PLT<50x109/L and PLT>50x109/L group (27.08 ± 21.32 vs 20.26±13.95, p = 0.52). (G–J) The percentage of Tc2 (G, H), and Tc17 (I, J) was no significant difference in nITP, pITP and cITP (0.10±0.07, 0.20±0.22 and 1.14±1.51, respectively, p=0.34 for Tc2; 0.22±0.20, 0.10±0.08 and 0.72±0.66, respectively, p=0.21 for Tc17) or platelet count (1.04 ± 1.65 vs 0.34 ± 0.49, p = 0.33 for Tc2; 0.72 ± 0.73 vs 0.25 ± 0.19, p = 0.14 for Tc17).Bars represent means ± SEM. p < 0.05 was considered significant.
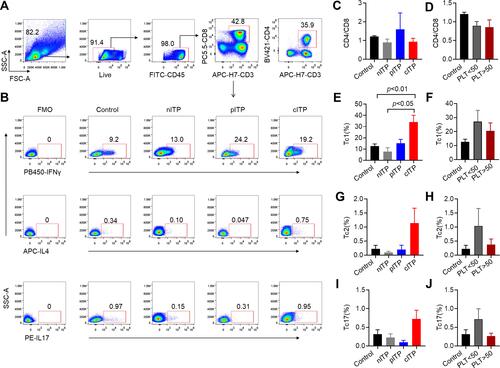
Figure 2 The percentage of helper cell T cells in ITP.
Note: (A) Representative IFN-γ+, IL-4+ and IL-17+ expression on CD3+CD8–T subsets (CD4+ T subsets) was shown. Cells are defined as follows: Th1:CD3+CD8−IFNγ+, Th2: CD3+CD8−IL4+, and Th17: CD3+CD8−IL17+. (B–G) The percentage of Th1 (B, C), Th2 (D, E) and Th17 (F, G) was no significant difference in nITP, pITP and cITP (8.56±8.84, 7.33±1.03 and 16.09±10.79, respectively, p = 0.35 for Th1; 0.20±0.17, 1.20±1.53 and 1.16±1.11, respectively, p = 0.30 for Th2; 0.20±0.17, 0.38±0.51 and 0.32±0.28, respectively, p = 0.73 for Th17) or platelet count (12.70±12.81 vs 12.82±7.42, p = 0.98 for Th1; 0.98 ± 1.15 vs 0.64 ± 0.81, p = 0.52 for Th2; 0.25±0.18 vs 0.27±0.26, p = 0.87 for Th17). Bars represent means ± standard error of mean. p < 0.05 was considered significant.
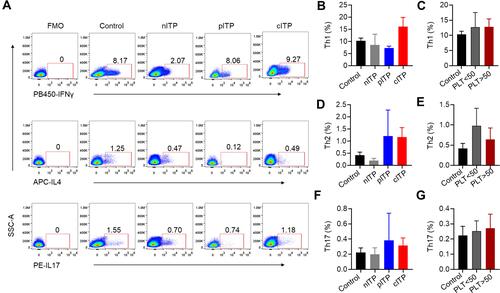
Figure 3 The percentage of Treg decreased in ITP patients.
Notes: (A) In the flow gating strategy, lymphocytes were first gated by forward scattering FSC and side scattering SSC, and then lymphocytes were circled by CD45. T lymphocytes were circled by CD3 and CD4 simultaneously. Treg cell was defined as CD4+CD127−CD25+. (B) PLT < 50x109/L and PLT > 50x109/L groups were lower than healthy control group (2.55 ± 1.47 vs 5.13 ± 1.92, p < 0.001; 3.32 ± 1.51 vs 5.13± 1.92, p < 0.05). Treg cells in PLT>50x109/L group were slightly increased compared to PLT<50x109/L group without statistically significant (3.32 ±1.51 vs 2.55 ± 1.47, p=0.22). (C) Compared with healthy control group, Treg in nITP, pITP and cITP was decreased (3.43 ± 1.47 vs 5.13 ± 1.92, p < 0.05; 3.38 ± 2.03 vs 5.13 ± 1.92, p = 0.09; 2.40 ± 1.24 vs 5.13 ± 1.92, p< 0.001). However, there was no significant difference among nITP, pITP and cITP (3.43 ± 1.47 vs 3.38 ± 2.03 vs 2.19 ± 1.04, respectively, p = 0.27). Bars represent means ± SEM. p < 0.05 was considered significant.
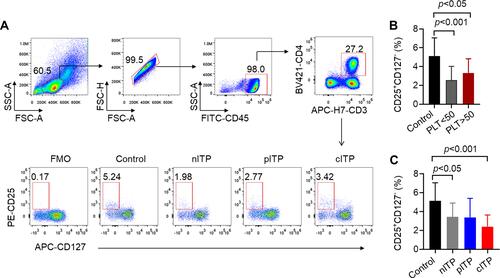
Figure 4 The expression of CXCR3, CCR6 and PD1 on CD4+ T cells increased in ITP patients.
Notes: (A) Representative histograms of the expression of CXCR3, CCR4, CCR6 and PD-1 on the surface of CD4+ T cells were detected by flow cytometry. (B) Compared with healthy controls, CXCR3 was significantly increased in the pITP and cITP groups (33.05 ± 7.49 vs 21.03 ± 6.52, p < 0.05; 39.10 ± 11.86 vs 21.03 ± 6.52, p < 0.01). There was no significant difference between nITP and healthy controls (21.45 ± 9.70 vs 21.03 ± 6.52, p = 0.92). Compared with nITP, CXCR3 in cITP increased significantly (39.10 ± 11.86 vs 21.45 ± 9.70, p < 0.05). (C) Compared with healthy controls, CD4+CXCR3+ was significantly increased in PLT>50x109/L groups (31.23 ± 11.22 vs 21.03 ± 6.52, p < 0.05). (D) There was no significant difference in CCR4 expression among nITP, pITP, cITP patients (19.23 ± 7.16 vs 24.95 ± 2.16 vs 22.25 ± 8.47, respectively, p= 0.46). (E) There was no significant difference in CD4+CCR4+ between PLT<50x109/L and PLT>50x109/L groups (21.33 ± 8.35 vs 20.60 ± 6.21, p = 0.88). (F) The expression of CD4+CCR6+ in cITP was significantly higher than that of healthy controls and nITP (27.33 ± 8.24 vs 8.59 ± 6.24, p < 0.001; 27.33 ± 8.24 vs 16.56 ± 8.30, p < 0.05). (G) Compared with healthy controls, CD4+CCR6+ was significantly increased in the PLT<50x109/L and PLT>50x109/L groups (21.86 ± 10.57 vs 8.59 ± 6.24, p < 0.01; 18.99 ± 9.55 vs 8.59 ± 6.24, p < 0.05). The percentage of CD4+CCR6+ was increased in PLT<50x109/L group compared with PLT>50x109/L, however, this elevation is statistically insignificant (21.86 ± 10.57 vs 17.58 ± 5.76, p = 0.32). (H) Compared with healthy controls, the expression of CD4+PD-1+ in cITP was significantly increased (17.01 ± 9.49 vs 8.70 ± 3.79, p < 0.05), but here was no significant difference of the expression CD4+PD-1+ among nITP, pITP and cITP (12.02±6.25 vs 10.00±3.51 vs 17.01±9.49, respectively, p = 0.25, ). (I) There was no significant difference between PLT< 50x109/L and PLT > 50x109/L (15.24 ± 9.56 vs 11.98 ± 5.07, p = 0.35). Bars represent means ± SEM. p < 0.05 was considered significant.
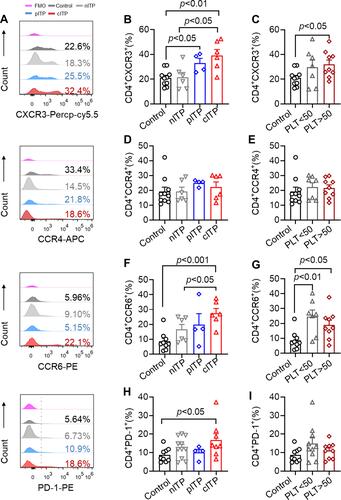
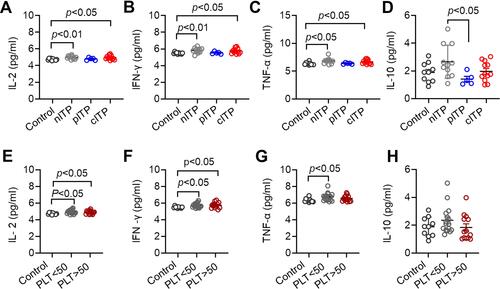
Figure 5 Serum levels of IL-2, IFN-γ, TNF-α in ITP patients were increased.
Notes: (A–C) The levels of IL-2, IFN-γ and TNF-α in nITP group and cITP group were significantly higher than those in healthy control group (A: 4.96 ± 0.22 vs 4.73 ± 0.11, p < 0.01, 4.93 ± 0.25 vs 4.73 ± 0.11, p < 0.05; (B) 6.16 ± 1.25 vs 5.49 ± 0.11, p < 0.01, 5.74 ± 0.30 vs 5.49 ± 0.11, p < 0.05; (C) 6.71 ± 0.53 vs 6.33 ± 0.24, p < 0.05, 6.65 ± 0.38 vs 6.33 ± 0.24, p < 0.05). (D) Compared with pITP, the secretion of IL-10 in nITP was increased, and the difference was statistically significant (2.61 ± 1.27 vs 1.75 ± 1.30, p <0.05). (E, F) The levels of IL2 and IFN-γ in ITP group (PLT<50x109/L and PLT> 50x109/L) were significantly increased compared with healthy controls (E: 4.94 ± 0.24 vs 4.73 ± 0.11, p < 0.05, 4.89 ± 0.21 vs 4.73 ± 0.11, p < 0.05; (F) 5.72 ± 0.27 vs 5.49 ± 0.11, p < 0.05, 5.74 ± 0.35 vs 5.49 ± 0.11, p < 0.05). (G) TNFα level in PLT < 50x109/L group was significantly higher than that in healthy control group (6.74 ± 0.48 vs 6.33 ± 0.24, p < 0.05). The difference of TNF-α was not statistically significant in PLT< 50x109/L and PLT > 50x109/L group (6.74 ± 0.48 vs 6.57 ± 0.37, p = 0.29). (H) The levels of IL-10 was not significantly different among different platelet counts (2.35±0.99vs1.83±0.92, p = 0.16). Bars represent means ± SD. p < 0.05 was considered significant.