Figures & data
Table 1 Univariate Analysis of Risk Factors Associated with Postoperative Complications
Table 2 The Composition and Contents of Modified Glasgow Prognostic Score (mGPS) and Postoperative Glasgow Prognostic Score (poGPS)
Table 3 Multivariate Analysis of Factors Associated with Postoperative Complications
Table 4 Accuracy of Risk Factors in Predicting Postoperative Complications
Figure 1 Receiver operating characteristic (ROC) curve of inflammation response-based indicators associated with postoperative complications.
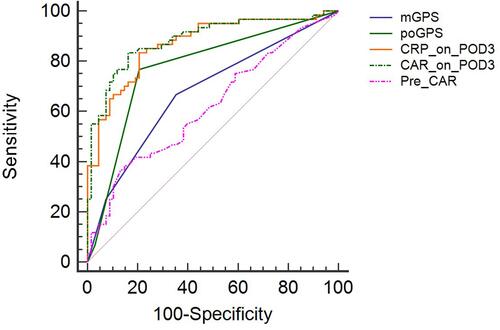
Table 5 Incidence of Postoperative Complications Between Two Groups According to Postoperative C-Reactive Protein/Albumin Ratio (CAR)
Table 6 CAR of Two Groups in Predicting Intra-Abdominal Infection
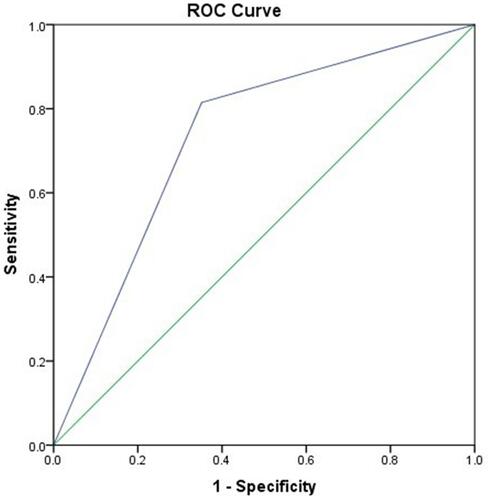
Figure 2 The receiver operating characteristic curve of CAR predicting abdominal infection on postoperative day 3 AUC=0.671, 95% CI=0.572–0.770, P=0.002.
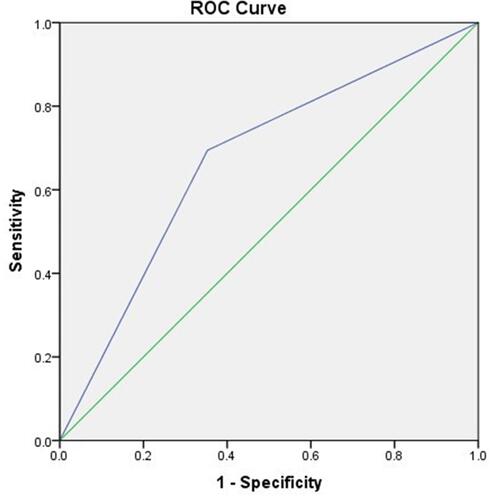
Figure 3 Receiver operating characteristic curve of CAR in predict of CR-POPF on postoperative day 3 AUC=0.732, 95% CI=0.633–0.830, P<0.001.