Figures & data
Table 1 Demographic and Neuropsychological Data for HCs, PD with Normal Cognition and PD with MCI
Figure 1 Whole-brain voxelwise pattern of the default mode network in each group. The DMN pattern for each group was obtained by using PCC (MNI coordinate: −2, −45, 34, radius = 6 mm) seed-based functional activity analysis. The random-effects one-sample t-test was performed and threshold was set at a corrected P < 0.01, determined by Monte Carlo simulation.
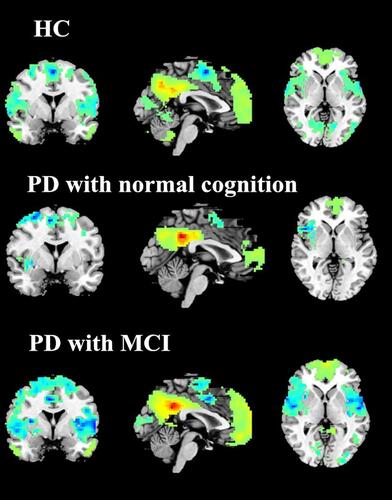
Table 2 Descriptions of Disease-Related Differences in DMN Revealed by One-Way ANOVA
Figure 2 One-way ANOVA of DMN functional connectivity. Thresholds were set at a corrected P < 0.01, determined by Monte Carlo simulation.
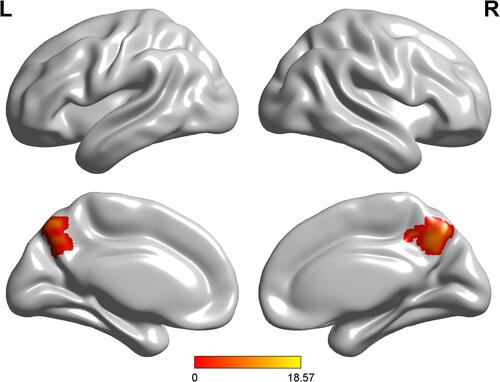
Figure 3 Group-level differences of the disease-related differences in DMN. Compared to PD patients with normal cognition and PD patients with MCI, the HCs showed significantly increased FC within BPcu. Further, there was also significant difference regarding the FC within BPcu between the two PD groups. ***Indicate P < 0.001.
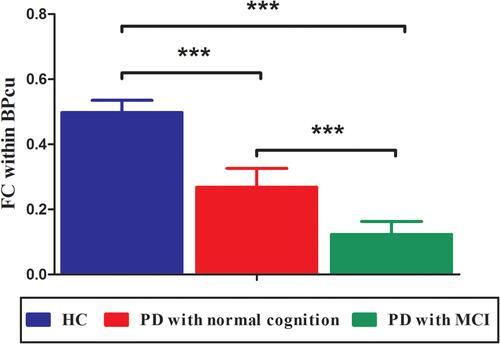
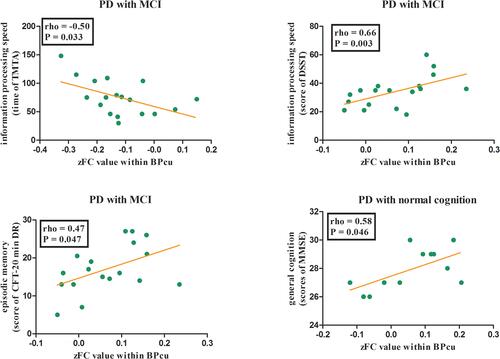
Figure 4 Behavior significances of the regions with disease-related differences in DMN. For PD patients with MCI, the higher FC within BPcu were related to better performances of TMTA, DSST and CFT-20 min DR. For PD patients with normal cognition, the FC within BPcu were associated with scores of MMSE.