Figures & data
Figure 1 Diagram of developing AMI hospital mortality prediction models.
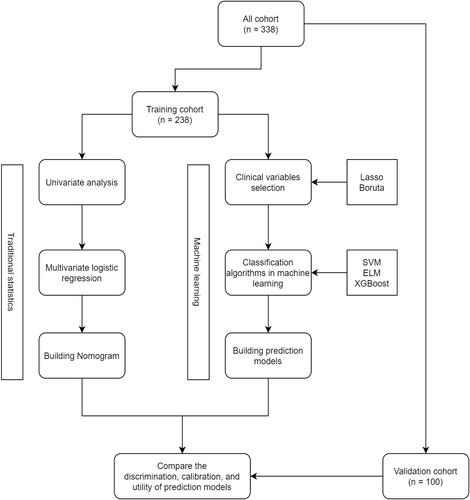
Table 1 Baseline Patient Demographics, Clinical and Laboratory Characteristics, and Outcomes
Table 2 Univariate Analysis for Potential Risk Factors in the Training Cohort
Table 3 Multivariate Logistic Regression Model for Hospital Mortality in the Training Cohort
Figure 2 The hospital death risk-prediction nomogram for AMI.
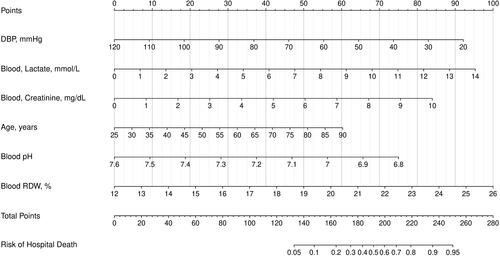
Table 4 The Comparison of Various Machine Learning Classifiers’ Performance Using Different Variable Selection Methods in the Validation Cohort
Figure 3 Comparison of ROC curves among nomogram and machine learning classifiers for the prediction of hospital death of patients with AMI in the validation cohort.
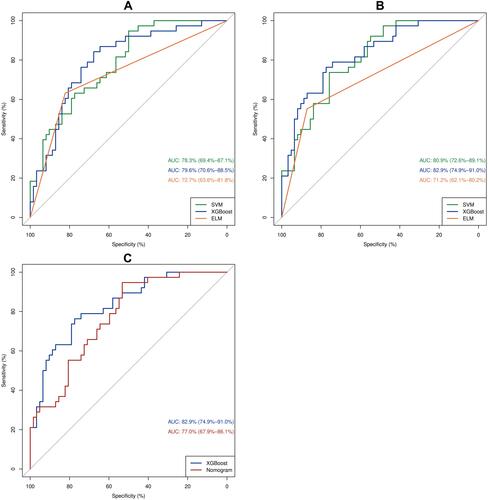
Figure 4 Calibration curves for the nomogram and the optimal machine learning classifier (XGBoost using clinical variables determined by Boruta) in the validation cohort.
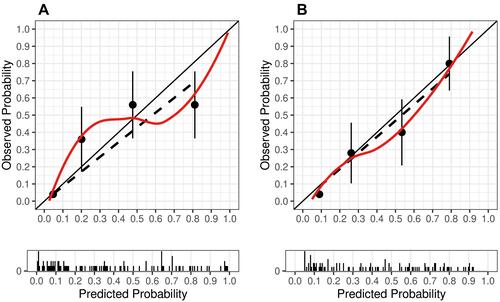
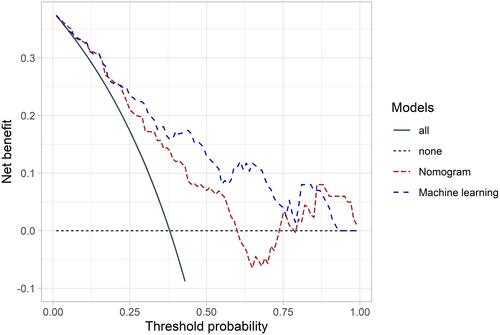
Figure 5 Decision curves for the nomogram and the optimal machine learning classifier (XGBoost using clinical variables determined by Boruta) in the validation cohort.