Figures & data
Table 1 Demographic Characteristics Among Patients
Figure 1 Impact of different clinical features on suicide risk by cancer sites.
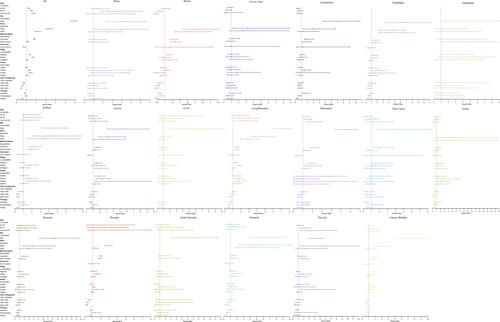
Figure 2 Trend in suicide rate for different gender, 1975–2017. (A) Suicide rate for male patients, (B) suicide rate for female patients.
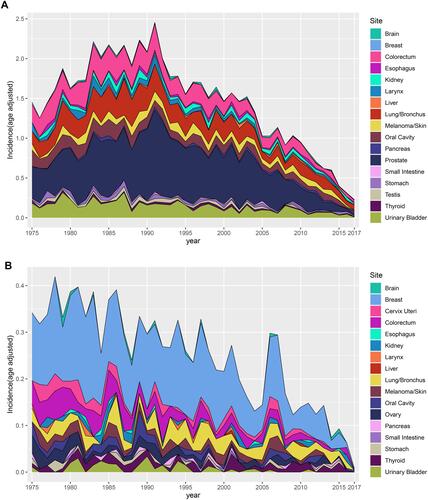
Table 2 Characterization of Socioeconomic Variables by Clusters
Figure 3 Patterns of SES factor scores across SES clusters. (A) All patient pattern, (B) male patient pattern, (C) female patient pattern.
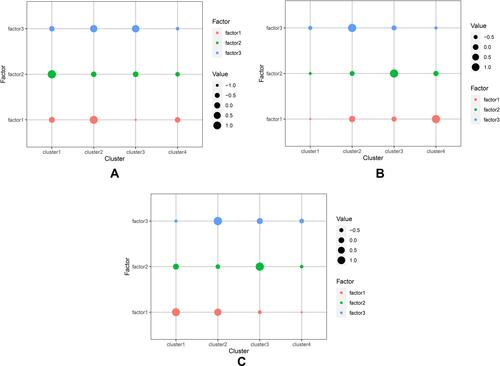
Figure 4 Adjusted hazard risk of primary solid tumor associated with socioeconomic factors (A) and clusters (B).
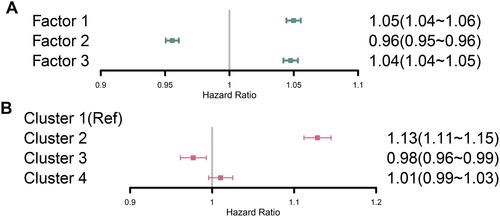
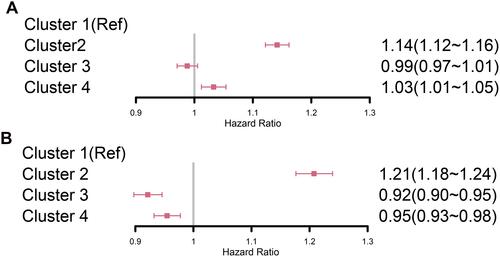
Figure 5 Adjusted hazard risk of primary solid tumor associated with socioeconomic clusters for different gender. (A) Adjusted hazard risk for male patients, (B) adjusted hazard risk for female patients.