Figures & data
Table 1 Characteristics of 89 Patients with Four Types of Aspheric IOLs Implantation
Table 2 Characteristics of Four Different Types of Aspheric IOLs
Figure 1 (A) IOL decentration and tilt were examined using the Pentacam® HR Scheimpflug system (Oculus, Wetzlar, Germany). (B) Coma was measured using the iTrace aberrometer (Tracey Technologies, Houston, TX, USA).
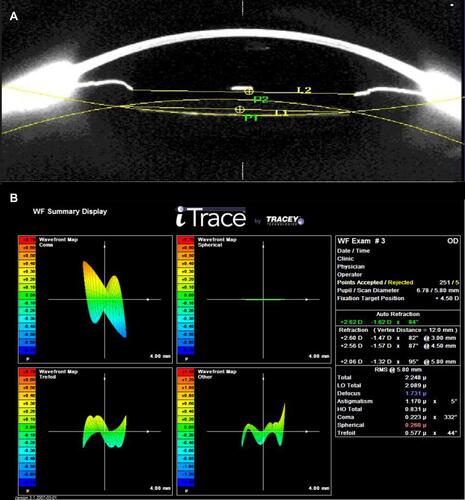
Figure 2 IOL decentration, tilt, and coma in the AO, 36A, IQ, and KS-AiN groups 1 week postoperatively. (A) Decentration. (B) Tilt. (C) Coma. (**p < 0.01; NS p > 0.05).
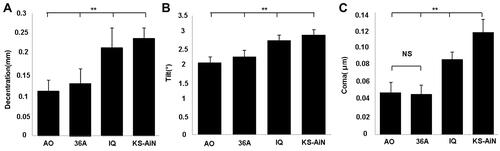
Figure 3 IOL decentration, tilt, and coma in the AO, 36A, IQ, and KS-AiN groups 1 year postoperatively. (A) Decentration. (B) Tilt. (C) Coma. (**p < 0.01; NS p > 0.05).
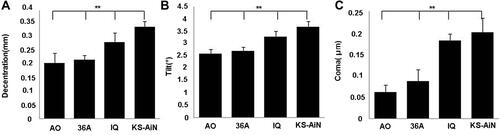
Figure 4 IOL decentration, tilt, and coma in the AO, 36A, IQ, and KS-AiN groups at 1 week, 1 month, 3 months, and 1 year postoperatively. (A) Decentration. (B) Tilt. (C) Coma. (*p < 0.05; NS p > 0.05).
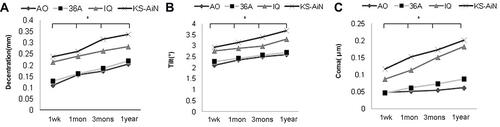
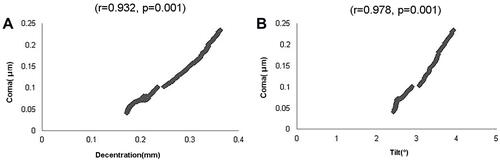
Figure 5 Correlation analysis between coma and decentration or tilt 1 year postoperatively. (A) Correlation analysis between decentration and coma. (B) Correlation analysis between tilt and coma.