Figures & data
Figure 1 Flowchart of the study.
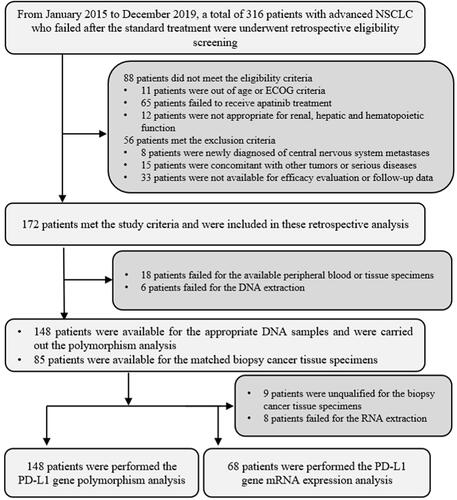
Table 1 Baseline characteristics based on PDL1 rs2297136 genotype status
Figure 2 Waterfall plot of best change (reductions in sum of target-lesion diameters) from baseline.
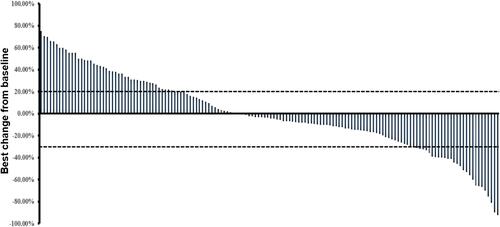
Figure 3 Progression-free survival and overall survival.
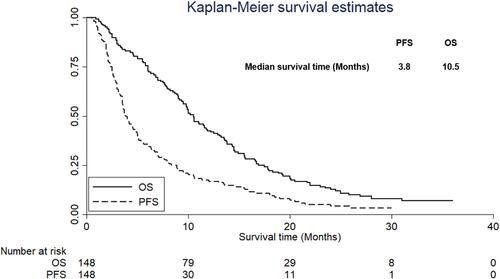
Table 2 Univariate analysis of progression-free survival based on baseline characteristics
Table 3 Multivariate Cox regression analysis for PFS based on baseline characteristics and rs2297136 polymorphism status
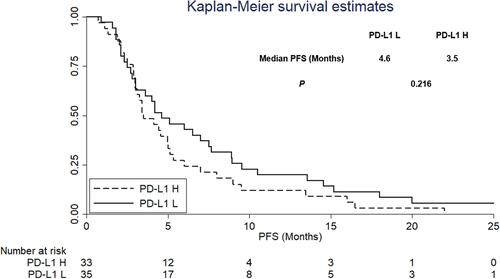
Figure 4 Progression-free survival based on PDL1 rs2297136 genotype status.
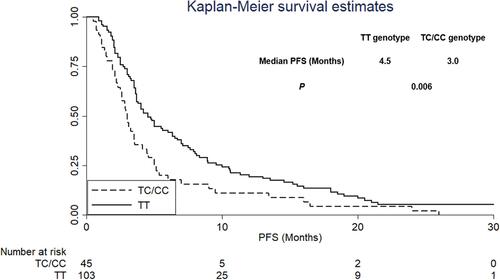
Figure 5 Overall survival based on PDL1 rs2297136 genotype status.
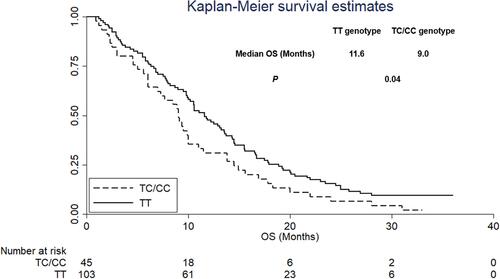
Table 4 Correlation analysis between PDL1 rs2297136 polymorphism and safety profile of apatinib administration
Figure 6 Relative expression level of PDL1 mRNA based on PDL1 rs2297136 genotype status.
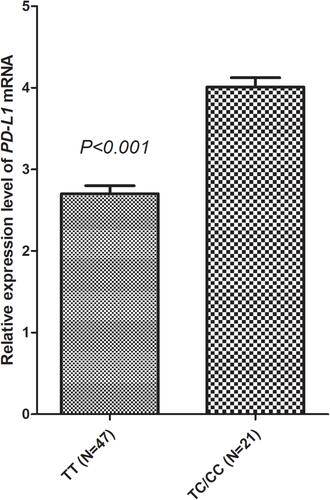
Figure 7 Progression-free survival of the 68 specimens from patients based on PDL1 mRNA–expression status.