Figures & data
Table 1 Relationships Between Patient Demographics and Clinicopathological Characteristics and FA Score with Characteristics
Figure 1 Kaplan-Meier survival curves comparing the three FA score groups.
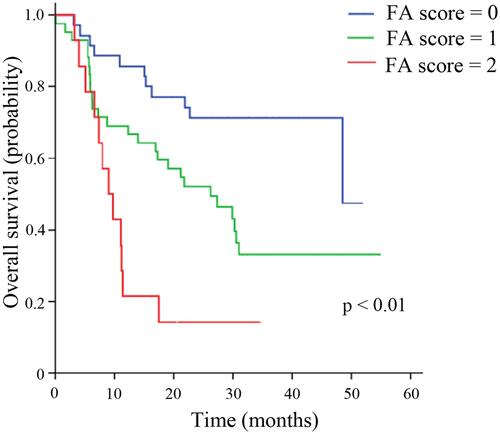
Figure 2 The comparative analyses between FA score and AFR. (A). Kaplan-Meier survival curves comparing the three albumin/fibrinogen ratio (AFR) score groups. (B). . Relationships between patient demographics and clinicopathological characteristics and FA score with characteristics.
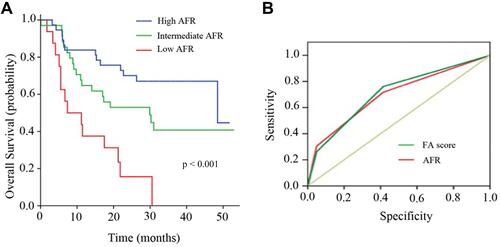
Table 2 The Result of Univariate Cox Hazards Analysis of Overall Survival
Table 3 The Result of Multivariate Cox Hazards Analysis of Overall Survival
Figure 3 A nomogram predicting 1-year and 3-year overall survival in patients with WHO Grade II/III gliomas.
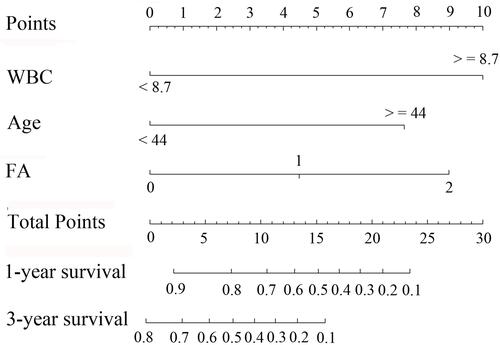
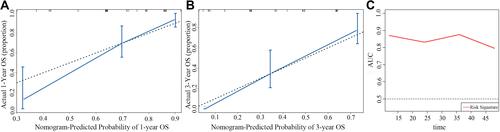
Figure 4 Validation of the nomogram. (A). The calibration curve of predicting patient survival percentages at 1 year. (B). The calibration curve of predicting patient survival percentages at 3 year. (C). The integrated area under the curve was calculated for the nomogram for every month.