Figures & data
Table 1 Baseline Characteristics
Table 2 Logistic Regression Analyses of the Relationship Between BMI, WHtR and Depression (Classified by Quartiles)
Table 3 Logistic Regression Analyses of the Relationship Between BMI, WHtR and Depression (Classified by Standard Guideline)
Table 4 Logistic Regression Analyses of the Relationship Between Co-Variables and Depression
Figure 1 Dose–response relationship between BMI and depression.
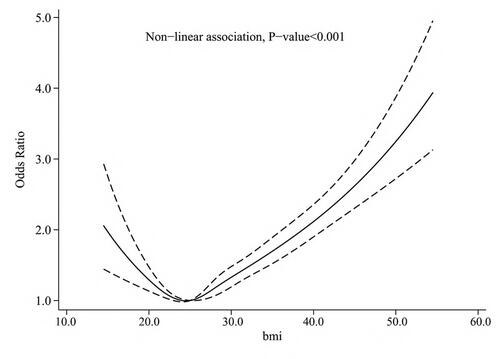
Figure 2 Dose–response relationship between WHtR and depression.
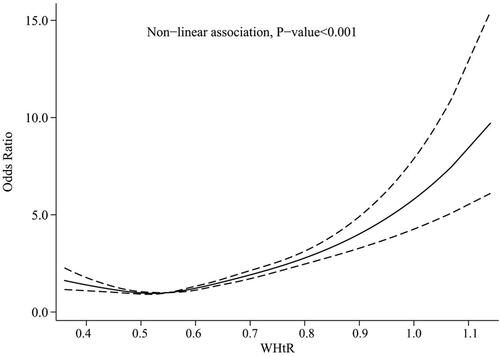
Figure 3 Dose–response relationship between BMI (A) and depression group by gender (male (A), female (B)).
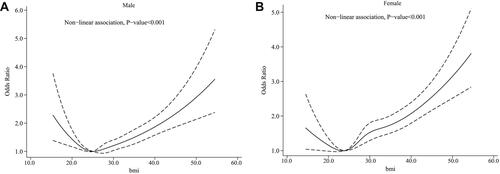
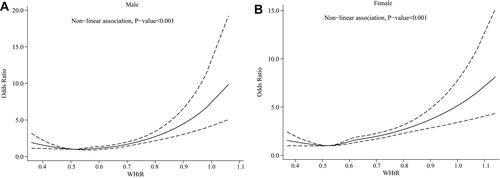
Figure 4 Dose–response relationship between WHtR and depression group by gender (male (A), female (B)).