Figures & data
Figure 1 UCA1 expression was elevated in UC patients and LPS-caused injury in FHCs. (A) RT-qPCR showed the relative UCA1 expression in colonic mucosa tissues of UC patients compared with healthy controls. (B) RT-qPCR showed the expression of UCA1 in FHCs stimulated by LPS. (C and D) CCK-8 and flow cytometry were used to determine the viability and apoptosis in FHCs stimulated by LPS. (E) ELISA showed the production of inflammatory cytokines including TNF-a, IL-6 and IL-1β after LPS treatments. *p<0.05.
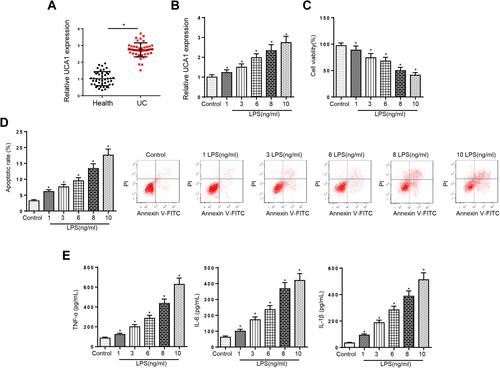
Figure 2 UCA1 deletion accelerates viability, suppresses apoptosis and cytokines production in LPS-treated FHCs. (A) RT-qPCR was used to determine the relative UCA1 expression in FHCs transfected with shUCA1. (B and C) FHCs were treated with different concentrations of LPS (1, 3, 6, 8, and 10 ng/mL). CCK-8 and flow cytometry were used to analyze the viability and apoptosis of FHCs stimulated by LPS, LPS+shNC, LPS+shUCA1 after different LPS treatments. (D) ELISA was used to determine the levels of IL-1β, IL-6 and TNF-α in FHCs stimulated by LPS, LPS+shNC, LPS+shUCA1 after different LPS treatments. *p<0.05.
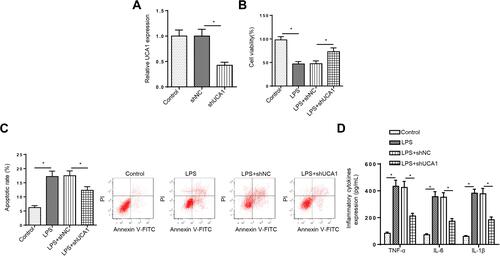
Figure 3 UCA1 inhibition improves LPS-triggered cell injury via sponging miR-331-3p. (A) StarBase website was used to predict the binding site between UCA1 and miR-331-3p. (B) Luciferase reporter assay showed luciferase activity of UCA1-wt or UCA1-mut in FHCs transfected with NC mimics or miR-331-3p mimics. (C) RT-qPCR showed the relative miR-331-3p expression in colonic mucosa tissues of UC patients compared with healthy controls. (D) RT-qPCR showed the relative miR-331-3p expression in FHCs transfection with pcDNA3.1, pcDNA3.1/UCA1, shNC or shUCA1. (E) Pearson’s correlation analysis showed the correlation between miR-331-3p and UCA1 in colonic mucosa tissues of UC patients. (F) RT-qPCR showed the relative miR-331-3p expression in FHCs transfected with NC mimics or miR-331-3p mimics and NC inhibitor or miR-331-3p inhibitor. (G–I) CCK-8, flow cytometry and ELISA were used to analyze the viability, apoptosis and inflammatory cytokines levels IL-1β, IL-6 and TNF-α of FHCs stimulated by LPS, LPS+shNC, LPS+shUCA1, and LPS+shUCA1+miR-331-3p inhibitor. *p<0.05.
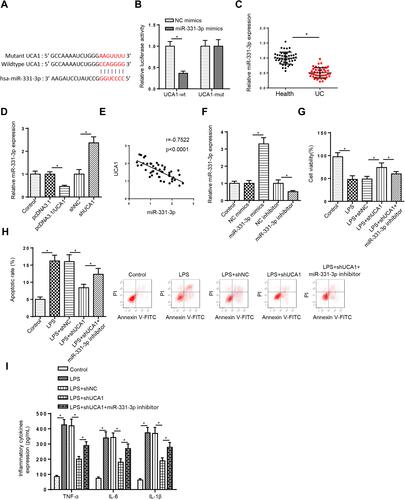
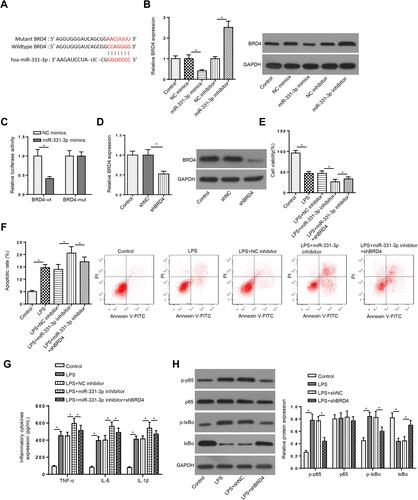
Figure 4 MiR-331-3p regulates LPS-triggered injury in LPS-induced FHCs by modulating BRD4 (A) StarBase website was used to predict the binding site between BRD4 and miR-331-3p. (B) RT-qPCR and Western blotting assays showed the mRNA and protein levels of BRD4 in FHCs transfected with NC mimics or miR-331-3p mimics and NC inhibitor or miR-331-3p inhibitor. (C) Luciferase reporter assay showed luciferase activity of BRD4-wt or BRD4-mut in FHCs transfected with NC mimics or miR-331-3p mimics. (D) RT-qPCR and Western blotting assays showed BRD4 expression of TIMP3 in FHCs treated with shBRD4. (E–G) CCK-8, flow cytometry and ELISA assays showed the viability, apoptosis and inflammatory cytokines levels of FHCs stimulated by LPS, LPS+NC inhibitor, LPS+miR-331-3p inhibitor, and LPS+miR-331-3p inhibitor+ shBRD4. (H) RT-qPCR and Western blotting assays determined the mRNA and protein levels of phosphorylated-p65 (p-p65), p65, phosphorylated-IκBα (p-IκBα), and IκBα of FHCs stimulated by LPS, LPS+shNC and LPS+shBRD4. *p<0.05.