Figures & data
Table 1 Baseline Characteristics of Patients and Healthy Control (HC)
Figure 1 Correlation analysis between the serum levels of citrulline, D-lactate, and lipopolysaccharide (LPS) and the APACHE-II and SOFA scores. (A) Citrulline was negatively correlated with APACHE-II score; (B) citrulline was negatively correlated with SOFA score; (C) D-lactate was positively correlated with APACHE-II score; (D) D-lactate was positively correlated with SOFA score; (E) LPS was positively correlated with APACHE-II score; (F) LPS was positively correlated with SOFA score.
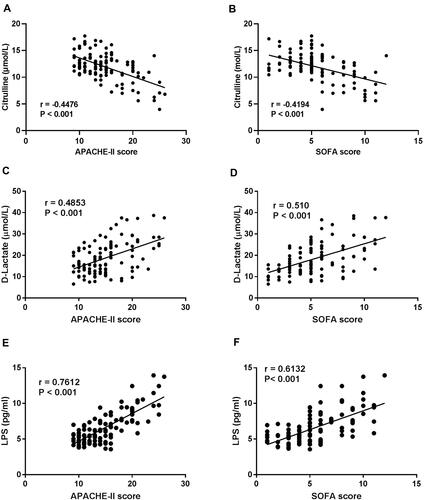
Figure 2 Citrulline serum level was elevated while D-lactate and lipopolysaccharide (LPS) serum levels were reduced in critically ill patients after treatment. (A) There were 52 out of 67 patients in the gastrointestinal dysfunction (GID) group and 33 out of 43 patients in the gastrointestinal failure (GIF) group displayed an increase in citrulline serum level after treatment. ***P < 0.001 vs Prior-treatment; (B) there were 48 out of 67 patients in the GID group and 34 out of 43 patients in the GIF group exhibited a decrease in D-lactate serum level after treatment. *P < 0.05 vs Prior-treatment; (C) there were 43 out of 67 patients in the GID group and 27 out of 43 patients in the GIF group showed an increase in LPS serum level after treatment. *P < 0.05 vs Prior-treatment.
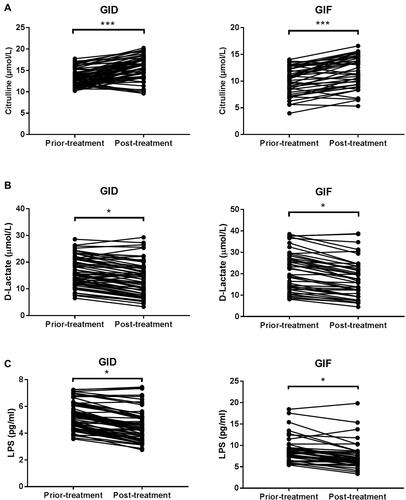
Table 2 Logistic Regression Analysis Was Performed to Analyze the Association Between the Serum Biomarkers (Citrulline, D-Lactate, and LPS) and Gastrointestinal Dysfunction (GID)
Table 3 Logistic Regression Analysis Was Performed to Analyze the Association Between the Serum Biomarkers (Citrulline, D-Lactate, and LPS) and Gastrointestinal Failure (GIF)
Table 4 Diagnostic Accuracies of Serum Biomarkers of Gastrointestinal Dysfunction (GID) and Gastrointestinal Failure (GIF)
Figure 3 Diagnostic value of serum citrulline or D-lactate in gastrointestinal failure (GID) and gastrointestinal failure (GIF). (A–C) ROC curve analysis was used to assess the value of serum citrulline to distinguish GID from healthy control (HC), GIF from GID, or GIF from HC; (D–F) ROC curve analysis was used for evaluating the value of serum D-lactate to distinguish GID from HC, GIF from GID, or GIF from HC.
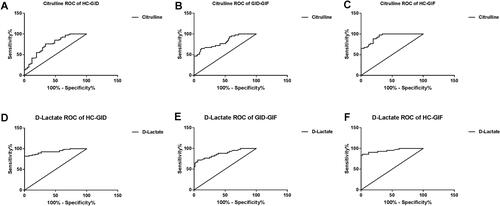
Table 5 Diagnostic Accuracies of Combinations of Serum Citrulline and D-Lactate of Gastrointestinal Dysfunction (GID) and Gastrointestinal Failure (GIF)
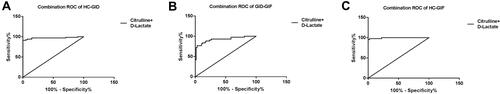
Figure 4 Diagnostic value of serum citrulline combined with serum D-lactate in the diagnosis of gastrointestinal failure (GID) and gastrointestinal failure (GIF). (A–C) ROC curve analysis was used to assess the combination of serum citrulline and serum D-lactate to distinguish GID from healthy control (HC), GIF from GID, or GIF from HC.