Figures & data
Figure 1 Study flowchart.
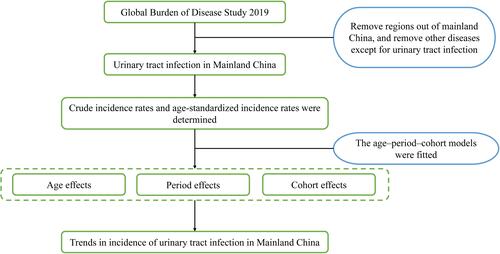
Figure 2 Trends in the age-standardized incidence rates (ASIRs) and crude incidence rates (CIRs) per 100,000 population for UTI by sex in Mainland China from 1990 to 2019. The GBD 2019 global age-standard population was used to assess the age-standardized incidence rate.
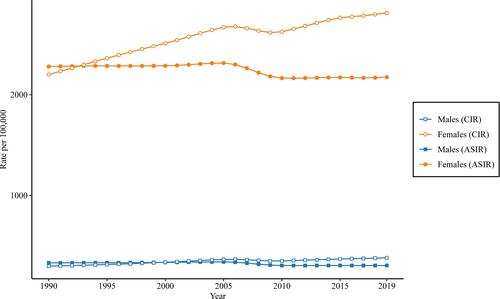
Figure 3 Local drift with net drift values for the incidence of UTI in Mainland China. Age-group-specific annual percentage change (local drift) with the overall annual percentage change (net drift) in the incidence rates of UTI and the corresponding 95% confidence intervals (CIs).
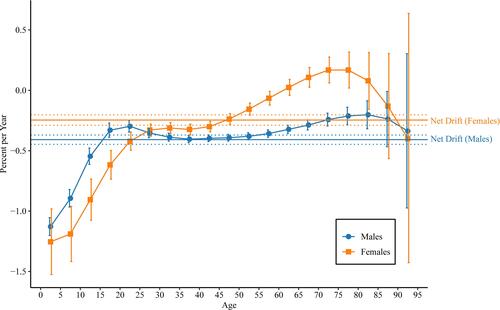
Figure 4 Longitudinal age curves of the incidence of UTI in Mainland China. Fitted longitudinal age-specific rates of the incidence of UTI (per 100,000 person-years) and the corresponding 95% CIs (some of them were too narrow to show in the figure).
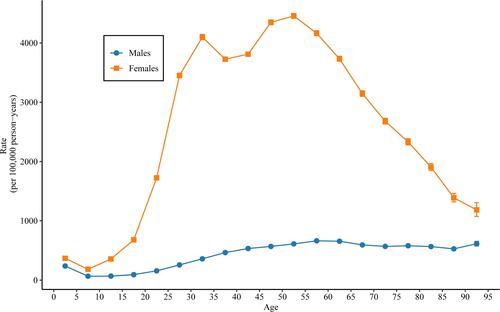
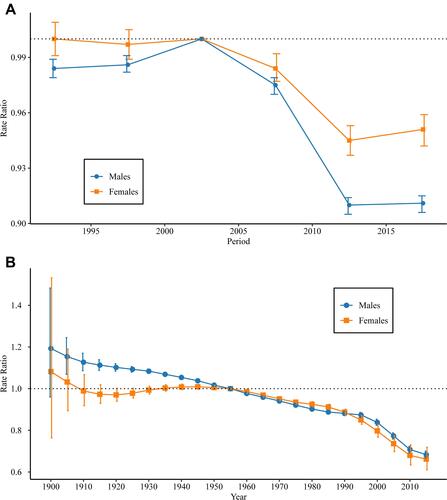
Figure 5 Period and cohort relative risks (RRs) of the incidence rate of UTI by sex in Mainland China. (A) For period RR and (B) for cohort RR. The period RR of each period compared with the reference (2000 to 2004) adjusted for age and nonlinear cohort effects, and the corresponding 95% CIs. The cohort RR of each cohort compared with the reference (the 1955 cohort) adjusted for age and nonlinear period effects, and the corresponding 95% CIs (some of them were too narrow to show in the figure).