Figures & data
Figure 1 The relationship between Mist1 expression and clinical pathology of cervical cancer. (A) Boxplot showing relative expression of Mist1 in tumor and normal tissues from TCGA-CESC patients via UALCAN. (B) Impact of Mist1 expression on overall survival in TCGA-CESC patients. (C) Impact of Mist1 expression on disease-free survival in TCGA-CESC patients. (D) Boxplot showing relative expression of Mist1 in nodal metastasis status (Normal, N0 or N1) from normal and CESC patients via UALCAN.
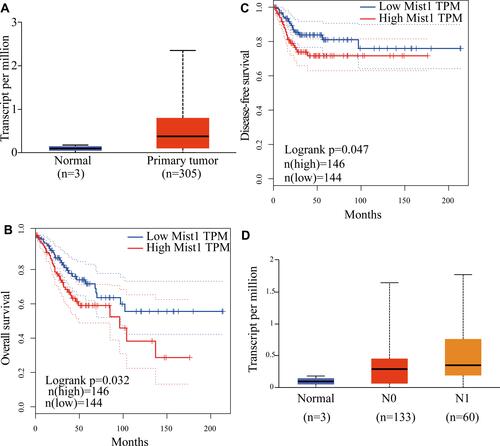
Figure 2 Functional annotations of Mist1 co-expressed genes and interaction proteins in TCGA-CESC. (A) Heat maps showing genes positively correlated with Mist1 in TCGA-CESC. (B) The scatter plot shows Pearson correlation of Mist1 expression with expression E-cadherin, N-cadherin, Snail and Vimentin in TCGA-CESC patients. (C) Protein–protein interaction network of Mist1 (GeneMANIA).
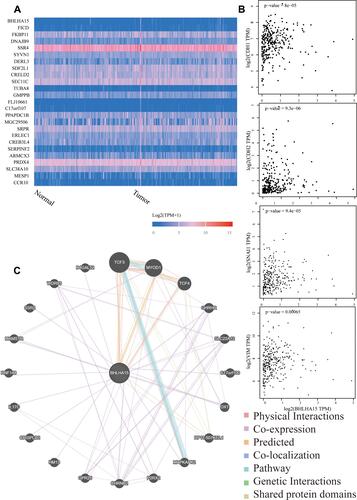
Table 1 The Demographic and Clinicopathological Characteristics of Patients with Cervical Cancer
Figure 3 The Mist1 expression in cancer and distal noncancerous tissues of patients with cervical cancer. *P <0.05, **P<0.01, ***P<0.001.
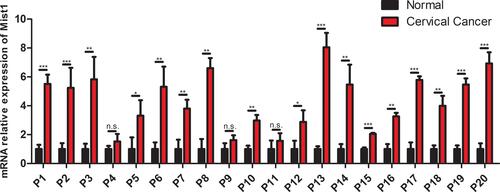
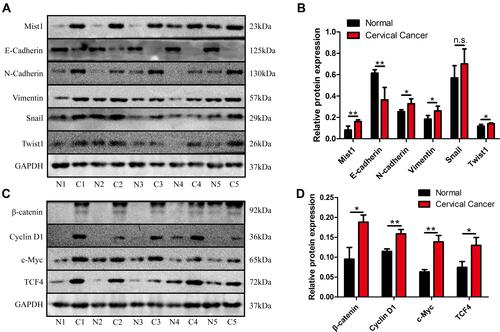
Figure 4 The relationship between Mist1 and EMT markers and Wnt signaling pathway in patients with cervical cancer. (A) The protein expression of Mist1, E-cadherin, N-cadherin, Snail, Vimentin and Twist was measured by the Western blot analysis. (B) Quantification of Mist1, E-cadherin, N-cadherin, Snail, Vimentin and Twist protein expression in patients with cervical cancer. (C) The protein expression of β-catenin, cyclin D1, c-Myc and TCF4 was measured by the Western blot analysis. (D) Quantification of β-catenin, cyclin D1, c-Myc and TCF4 protein expression in patients with cervical cancer. *P <0.05, **P<0.01.