
Figures & data
Figure 1 Sex of participants.
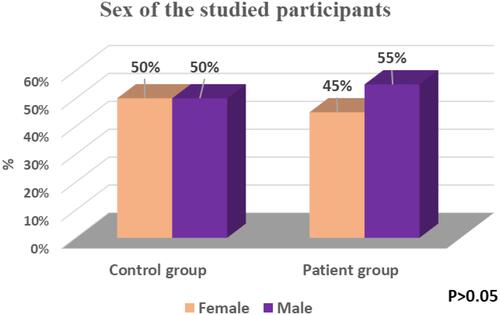
Figure 2 Age of participants.
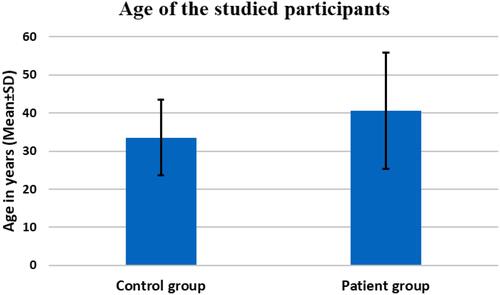
Table 1 Comparisons Among Control (n=20), HD (n= 20), and CKD (n=20) groups on Hemoglobin, Uric Acid, HCO3, eGFR, Urea-Reduction Ratio, Urea, and Creatinine
Table 2 Comparisons Among Control (n=20), HD (n= 20), and CKD (n=20) Groups on Respiratory Function Tests
Table 3 Comparisons Among Control (n=20), HD (n= 20), and CKD (n=20) Groups on Acoustic Parameters
Table 4 Correlations between duration of HD and demographic data, laboratory tests, respiratory function tests, and acoustic parameters
Table 5 Correlations Between Laboratory Tests and Respiratory Function Tests Against Acoustic Parameters in the HD Group
Table 6 Correlations between Laboratory Tests and Respiratory Function Tests Against Acoustic Parameters in the CKD Group
Table 7 Linear Regression for Predictors of Changes of Acoustic Parameters