Figures & data
Table 1 Basic Characteristics of Patients with Locally Advanced Pancreatic Head Carcinoma (n=67)
Figure 1 Comparison of liver function between the two groups (SEMS-CL-125I and the combined group) before and after operation. Changes of (A) TBIL, (B) DBIL, (C) ALT, (D) AST, (E) ALP and (F) ALB at 1 month, 3 months and 6 months postoperatively (*p<0.05 compared with preoperative values in the SEMS-CL-125I group; #p<0.05 compared with preoperative values in the combined group).
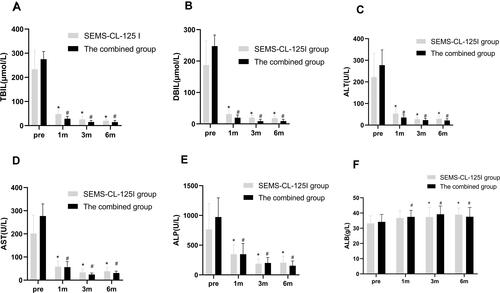
Table 2 Comparison of Pain Indexes (Based on VRS Scores) in the SEMS-CL-125I Group and the Combined Group Preoperative and Postoperative
Table 3 Imaging Assessment, Pain Index and Complications Related Information of Postoperative Patients
Figure 2 CT images of the combined group and the SEMS-CL-125I group preoperatively and 3 months postoperatively. (A and B) CT comparison between preoperative and postoperative reexaminations at 3 months in the SEMS-CL-125I group. (C and D) CT comparison between preoperative and postoperative review at 3 months in the combined group (white and red arrows indicate the location of the tumor).
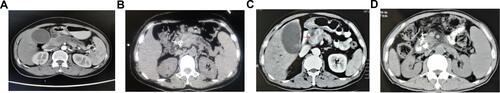
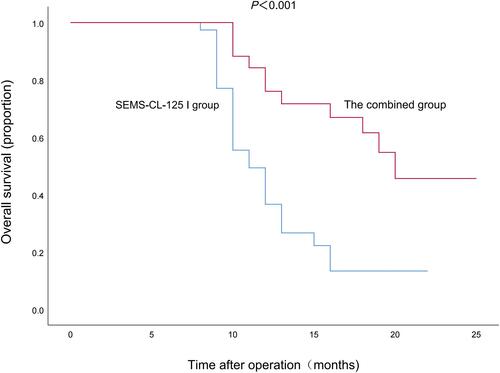
Figure 3 Kaplan–Meier cumulative survival curves detected the survival prognosis of the two groups. Compared with the SEMS-CL-125I group, the combined group had a better survival prognosis. The median survival of the SEMS-CL-125I group (9 months) was much lower than that of the combined group (17 months).