Figures & data
Table 1 Characteristics of All Participants
Figure 1 Serum IL-37 level is positively correlated with the RA progression. (A) Serum IL-37 level comparison in the 5 groups of participants. P<0.0001 is the One-way ANOVA analysis among the 5 groups. (B) Correlation analysis of serum IL-37 level and the DAS28 in all RA patients. (C) ROC of serum IL-37 level and the DAS28 in all RA patients.
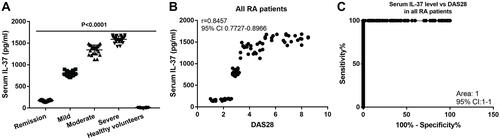
Figure 2 IL-37 mRNA expression level in PBMC is positively correlated with the RA progression. (A) IL-37 mRNA expression level in PBMC comparison in the 5 groups of participants. P<0.0001 is the One-way ANOVA analysis among the 5 groups. (B) Correlation analysis of IL-37 mRNA expression level in PBMC and the DAS28 in all RA patients. (C) ROC of IL-37 mRNA expression level in PBMC and the DAS28 in all RA patients. Y axis in (A) and (B) is the 2−ΔΔCt value of IL-37 normalized to the 2−ΔΔCt value of β-actin.
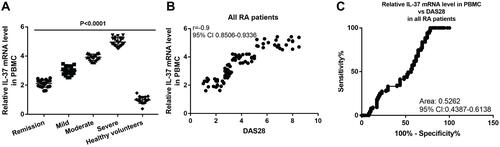
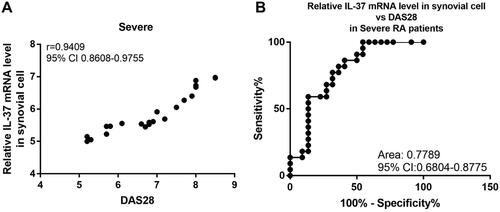
Figure 3 IL-37 mRNA expression level in synovial cells is positively correlated with the RA progression. (A) Correlation analysis of IL-37 mRNA expression level in synovial cells and the DAS28 in RA patients of the severe group. Y axis is the 2−ΔΔCt value of IL-37 normalized to the 2−ΔΔCt value of β-actin. (B) ROC of IL-37 mRNA expression level in synovial cells and the DAS28 in RA patients of the severe group.