
Figures & data
Figure 1 Chronic diseases prevalence by age (A) and gender (B) among middle-aged and elderly Chinese.
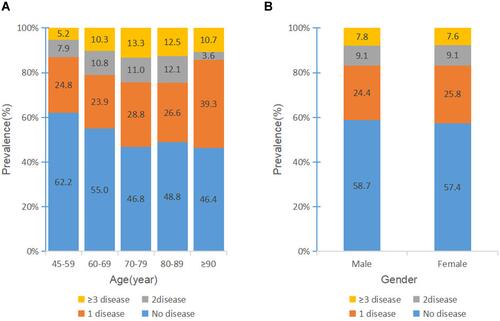
Figure 2 Distribution of the number of patients with the disease.
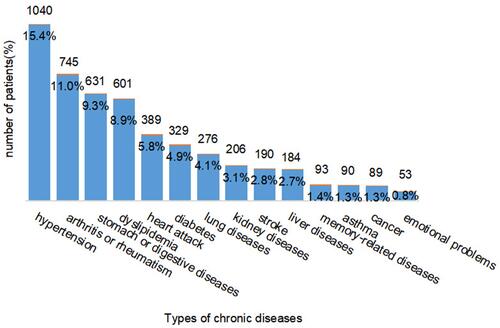
Table 1 Basic Information of the Number of Chronic Diseases
Table 2 The Prevalence Rate of the Top 10 Binary Comorbidities Combinations
Table 3 The Prevalence Rate of the Top 6 Ternary Comorbidities Combinations