
Figures & data
Table 1 Baseline Characteristics of the Study Population
Table 2 Echocardiographic Data of the Study Population
Figure 1 Bee chart of difference in GLS between NHT and MHT groups.
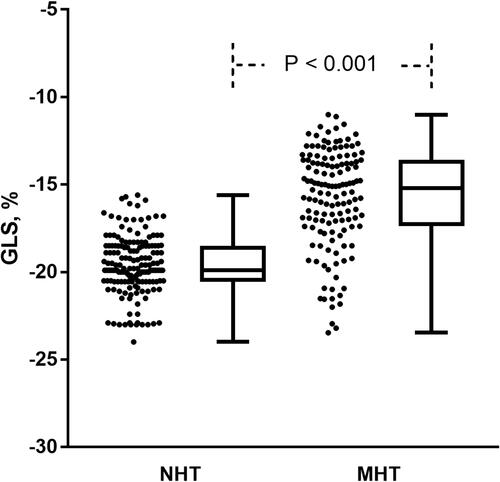
Figure 2 Forest plot of association between MHT and related factors in the study subjects.
Abbreviations: BMI, body mass Index; LDL-C, low-density lipoprotein cholesterol; UA, uric acid; LVMI, left ventricular mass index; GLS, global longitudinal strain. CI, confidence interval.
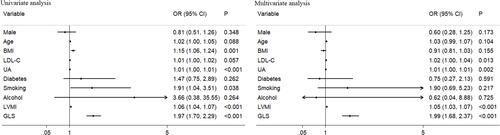
Figure 3 Values of parameters on ROC curve to show the relationship between variable and MHT.
Notes: (A) Univariate analysis for GLS or E/e’; (B) Multivariate analysis for GLS or E/e’, adjusted for gender, age, BMI, LDL-C, UA, diabetes, smoking, alcohol and LVMI.
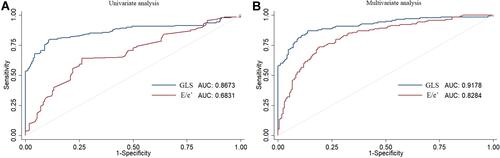
Figure 4 Non-linear relationship between GLS and MHT after adjustment for covariates.
Notes: The x-axis shows GLS, and the y-axis shows the incidence of MHT, with the dotted lines area representing 95% confidence intervals (Linear trend: P < 0.001); Adjusting for gender, age, BMI, LDL-C, UA, diabetes, smoking, alcohol and LVMI.
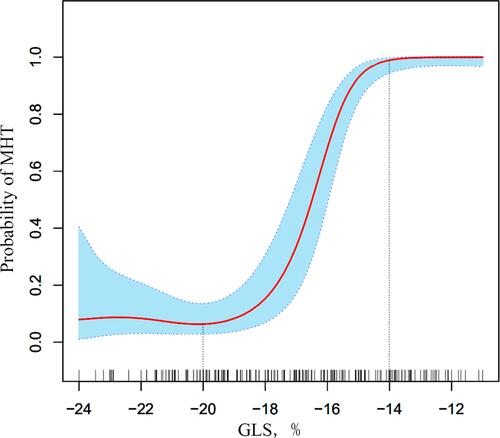
Table 3 Intra- and Inter-Observer Variability