Figures & data
Figure 1 Flowchart for the COVID-19 vaccine questionnaire participants.
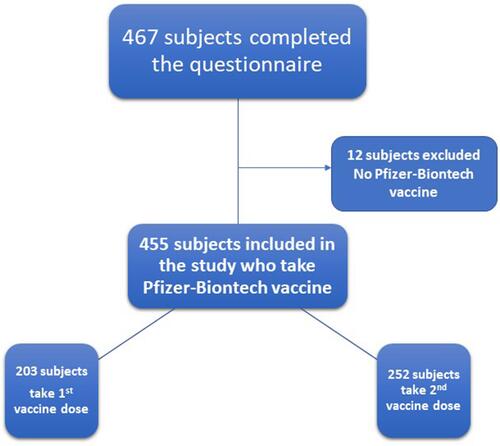
Table 1 The Study Participants’ Demographic Characteristics, COVID-19 Past Infection, Type of Vaccine, Number of Vaccine Doses, and the Onset of Side Effects
Table 2 The Reported COVID-19 Vaccine Side Effects and Their Correlation with the Vaccine’s First, Second, and Both Doses
Figure 2 The percentage absence (no symptoms) and presence (yes symptoms) of COVID-19 side effects reported by the study participants following the vaccine’s first, second, and both doses. Results were offered as frequency (percentage (%)).
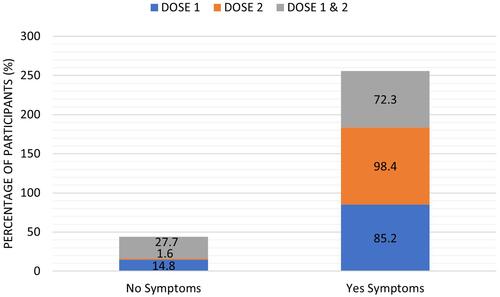
Figure 3 The reported COVID-19 vaccine side effects after the vaccine’s first, second, and both doses. Results were offered as frequency (percent (%)).
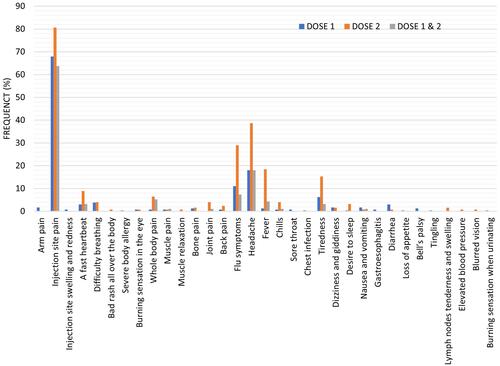
Table 3 The Reported COVID-19 Vaccine Side Effects and Their Correlation with the Participants Ages
Figure 4 The reported COVID-19 vaccine side effects distribution according to the participants’ ages. Results were offered as frequency (percent (%)).
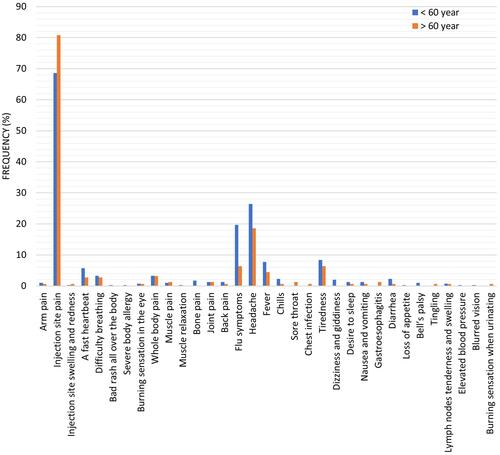
Figure 5 The correlation between presence and absence of COVID-19 vaccine side effects and the participant’s sex. Results were offered as frequency (percent (%)). Correlation between variables was evaluated using the Chi-square test. ***Significant difference at p ≤ 0.001.
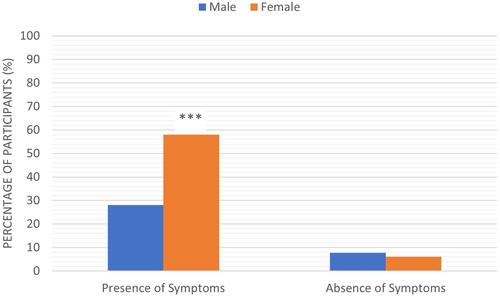
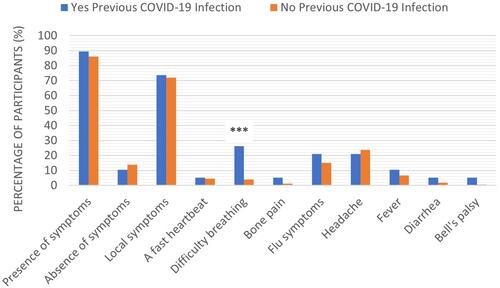
Figure 6 The reported COVID-19 vaccine side effects distribution in participants previously infected with coronavirus versus non-previously infected participants. Results were offered as frequency (percent (%)). Correlation between variables was evaluated using the Chi-square test. ***Significant difference at p ≤ 0.001.