Figures & data
Table 1 Correlations Between Serotonin Expression and Clinical Parameters in TPBC and TNBC Patients
Figure 1 Serotonin expression in the cultured human breast cancer cell line. Immunofluorescence staining was used in order to identify whether cultured human breast cancer cell lines (MCF-7, Bcap-37), human breast epithelial cell line (MCF-10A), and mouse breast cancer cells (4T1) expressed serotonin. Serotonin immunoreactivity (green) in the cultured human breast cancer cell lines (MCF-7, Bcap-37), human breast epithelial cell line (MCF-10A), and mouse breast cancer cells (4T1) was clearly present (A). It shows that serotonin expression was increased in the cultured human breast cancer cell lines (MCF-7, Bcap-37) compared with human breast epithelial cell line (MCF-10A) (B). Values were expressed as mean ± S.E.M.; **p<0.01, ****p<0.0001.
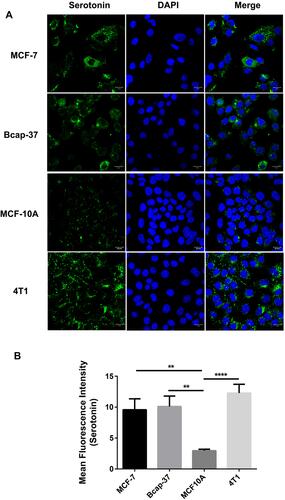
Figure 2 The expression of melatoninergic systems in the cultured human breast cancer cell line. Western blotting analysis was used in order to determine whether NAT and ASMT was expressed in the cultured human breast cancer cell lines (MCF-7, Bcap-37), human breast epithelial cell line (MCF-10A), and mouse breast cancer cells (4T1). NAT (A and B) and ASMT (C and D) protein expression measured by Western blotting and quantification of NAT and ASMT level relative to GAPDH. GAPDH was used as an internal control in order to measure the quality of protein. (E) Melatonin level was determined in the human breast cancer cell lines (Bcap-37, MCF-7, BT474, MDA-MB-231) and human breast epithelial cell line (MCF-10A) culture medium. All the cultured cells were incubated up to a number to 2×10⁵ in vitro. There was a very low amount of melatonin in the 10%FBS medium. Values were expressed as mean ± S.E.M.; ****p<0.0001; ***p<0.001; **p<0.01; *p<0.05.
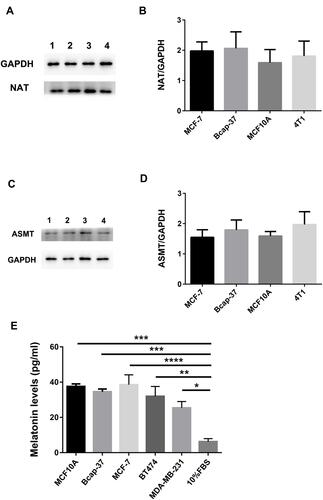
Figure 3 Serotonin expression in the cultured BT-474 and MDA-MB-231 cells. Serotonin immunoreactivity (green) in the cultured BT-474 and MDA-MB-231 cells was clearly present (A). It indicates that serotonin expression was increased in both BT474 and MDA-MB-231 cells compared with human breast epithelial cell line (MCF-10A). In addition, serotonin expression was much higher in BT474 compared with MDA-MB-231 cells (B). Values were expressed as mean ± S.E.M.; **p<0.01 (n=10); ****p<0.0001.
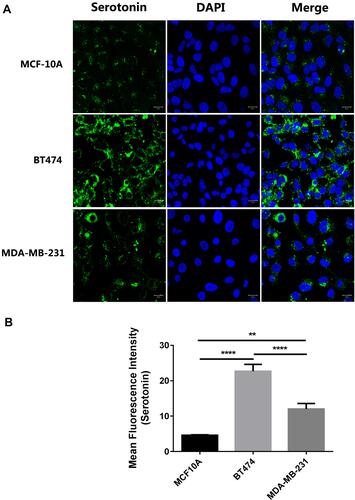
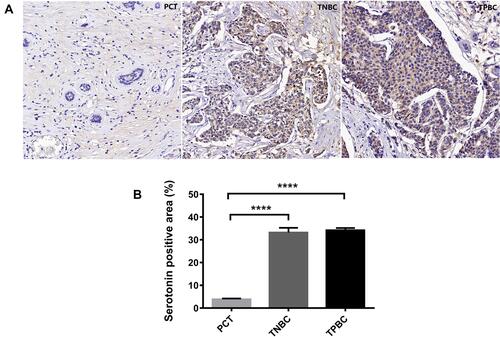
Figure 4 Serotonin expression in the TPBC and TNBC tumor sections. Immunostaining analysis using antibodies against serotonin on tumor sections and PCT of TPBC and TNBC. The nuclei were stained with Hematoxylin (blue) (A). Quantification of serotonin positive areas relative to total areas (B). Values were expressed as mean ± S.E.M.; ****p<0.0001.