Figures & data
Table 1 Clinicopathological Characteristics of All Patients
Table 2 Logistic Regression Models for AKI of Laboratory Parameters in the Test Cohort
Table 3 Multivariate Logistic Regression Analyses of ASII Scores for AKI
Figure 1 Kaplan–Meier curves for in-hospital survival for all patients stratified by ASII in the test set (A), in the internal validation ser (B), and in the external validation set (C). Kaplan–Meier curves for 2-year survival for all patients stratified by ASII in the test set (D), in the internal validation ser (E), and in the external validation set (F).
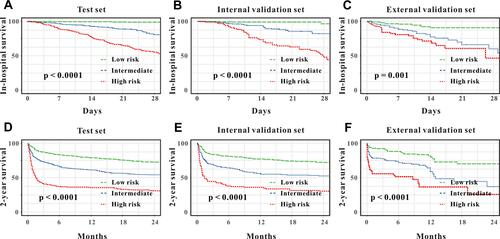
Figure 2 Evaluation of AKI (A) and 2-year mortality (B) associated nomograms for ICU patients.
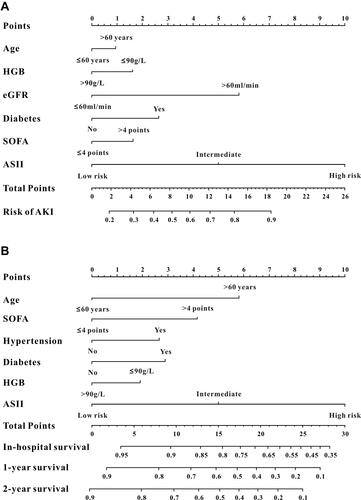
Figure 3 Calibration curves for AKI and mortality for ICU patients. The calibration curves for predicting AKI in the training set (A), in the internal validation set (B), and in the external validation set (C). The calibration curves for predicting all-cause mortality at 1-year (D) and 2-year (G) in the training set, and 1-year (E) and 2-year (H) in the internal validation set, and 1-year (F) and 2-year (I) in the external validation set.
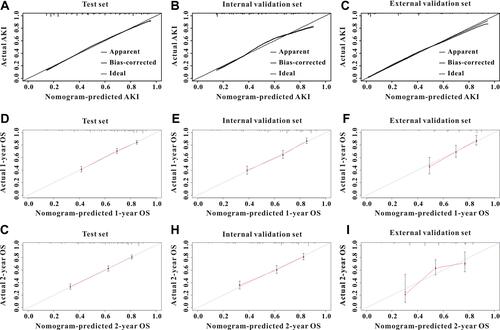
Table 4 Cox Proportional Hazards Analysis of the Ability of ASII for Secondary Outcomes in Training Set
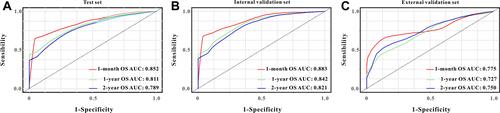
Figure 4 Time-dependent ROC curves by 2-year survival associated nomogram for predicting 1-month, 1-year, and 2-year survival rates in the training (A) set, in the internal validation set (B), and in the external validation set (C).