
Figures & data
Figure 1 Estimation of Young’s modulus using shear-wave elastography in a kidney. The region of interest box was placed in the mid portion of the right renal cortex. On the right is the normal shear-wave velocity, measured in real time the maximum elastic value (Emax), average elastic value (Emean), minimum elastic value (Emin).
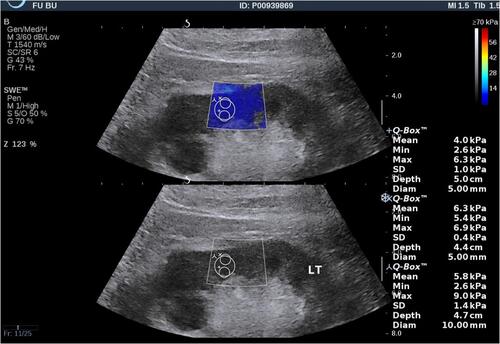
Table 1 Clinical and Laboratory Parameters in the Diabetic Nephropathy and Control Groups
Table 2 Renal Hardness in Control Participants and Those with Diabetic Nephropathy
Table 3 Renal Parenchymal Hardness in the Groups of Participants
Table 4 Multivariable Linear Regression Analysis Data