Figures & data
Table 1 Baseline Characteristics of Patients Stratified by New-Onset Acute Kidney Injury
Table 2 Outcomes Between Patients with and without New-Onset AKI
Table 3 Levels of Plasma SO2 and Urine Biomarkers in New-Onset AKI and Non-AKI Patients
Figure 1 Discrimination of plasma SO2 between non-AKI and AKI of different severities. ***Comparison between non-AKI and AKI of different severities (p<0.001).
Abbreviations: AKI, acute kidney injury
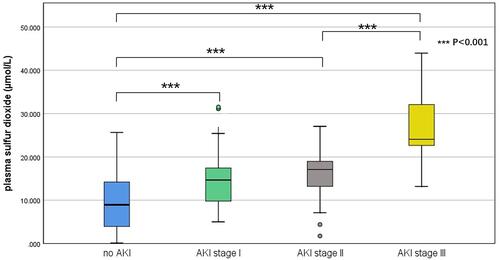
Figure 2 Predictive value of plasma SO2 and urine biomarkers for new-onset AKI.
Abbreviations: AKI, acute kidney injury; SO2, Sulfur dioxide; NGAL, neutrophil gelatinase-associated lipocalin; TIMP-2, tissue inhibitor of metalloproteinases-2; IGFBP7, insulin-like growth factor-binding protein 7.
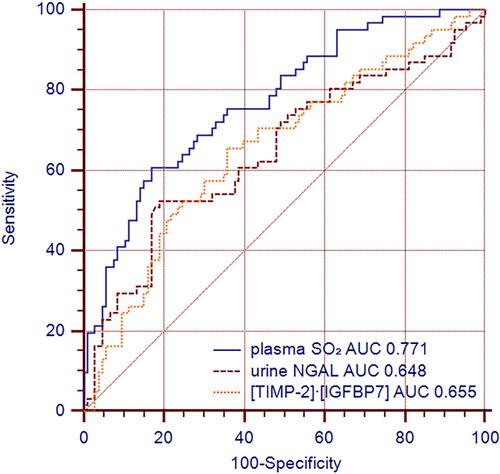
Table 4 Comparison of the ROC Curves, NRI and IDI of Combination vs Clinic Models in Predicting AKI
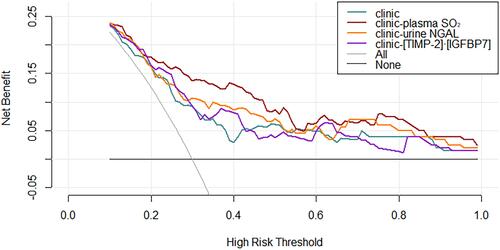
Figure 3 Decision curve for prediction of new-onset AKI using different prediction models.
Abbreviations: AKI, acute kidney injury; SO2, Sulfur dioxide; NGAL, neutrophil gelatinase-associated lipocalin; TIMP-2, tissue inhibitor of metalloproteinases-2; IGFBP7, insulin-like growth factor-binding protein 7.