Figures & data
Figure 1 (A) Ultrasound image of proliferative endometrium in the figure. SWE showed a relatively uniform blue area in the endometrium. (B) Ultrasound image of secretory endometrium. SWE showed a uniform blue area in the endometrium. (C) Pathologic results confirmed an endometrial polyp in the uterine cavity. SWE showed the poly was relatively uniform blue. (D) Pathologic results confirmed hyperplastic endometrium. SWE showed the endometrium was blue. (E) Pathologic results confirmed an endometrial cancer in the uterine cavity. SWE showed tumor lesions of a mixture of red, yellow and blue.
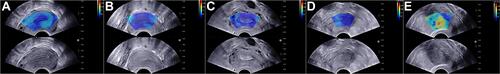
Table 1 Comparison of Emean, Emax and Esd Between Endometrial Carcinoma and Normal Endometrium (Average±Standard Deviation)
Table 2 Comparison of Emean, Emax and Esd Among Groups of Endometrial Carcinoma, Proliferative Endometrium, and Secretory Endometrium (Average±Standard Deviation)
Table 3 Comparison of Emean, Emax and Esd Among Groups of Endometrial Carcinoma, Endometrial Polyp, and Endometrial Hyperplasia (Average±Standard Deviation)
Table 4 Comparison of Emean, Emax and Esd Among Groups of Proliferative Endometrium, Secretory Endometrium, Endometrial Polyp, and Endometrial Hyperplasia (Average±Standard Deviation)
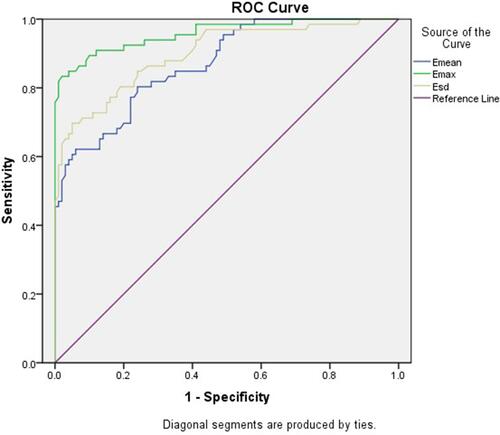
Table 5 Comparison of Diagnosis Value Among Different Methods of Emean, Emax, Esd
Figure 2 Receiver operating characteristic curves of Emean, Emax and Esd to identify normal endometrial and endometrial cancer.