Figures & data
Figure 1 Computed tomography angiogram oblique transversal plane perpendicular to the aortic annulus plane in a 25-year-old male (A): width of the SOV; (B) width of the STJ) and a 59-year-old male (C) width of the SOV (D) width of the STJ.
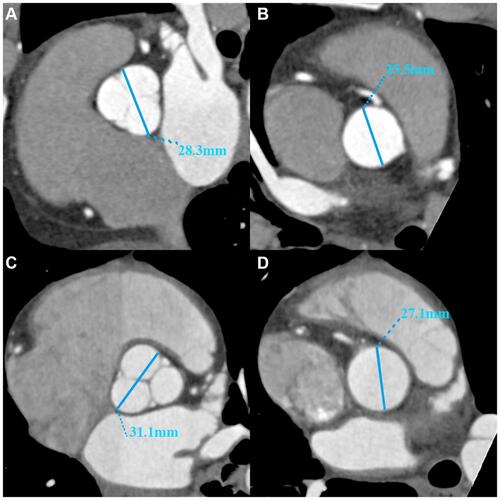
Figure 2 Computed tomography angiographic double oblique transverse images of the aortic annulus and coronary ostia height in a 53-year-old male (A) Aortic annulus dimension; (B) Right ostia to annulus; (C) Left coronary ostia to annulus) and 54-year-old female (D) Aortic annulus dimension; (E) Right ostia to annulus; (F) Left coronary ostia to annulus.
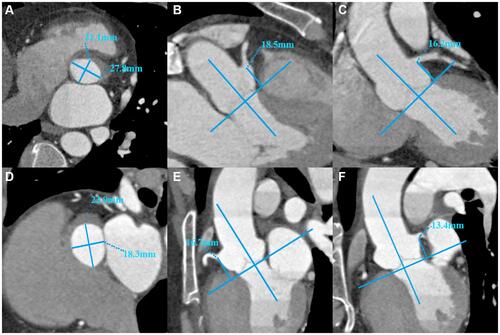
Table 1 Patients’ Baseline Characteristics
Table 2 Aortic Root Dimensions in Males According to Age Groups After Correction for BSA
Table 3 Aortic Root Dimensions in Females According to Age Groups After Correction for BSA
Table 4 Correlation of Aortic Root Dimension with Age After Correction for BSA
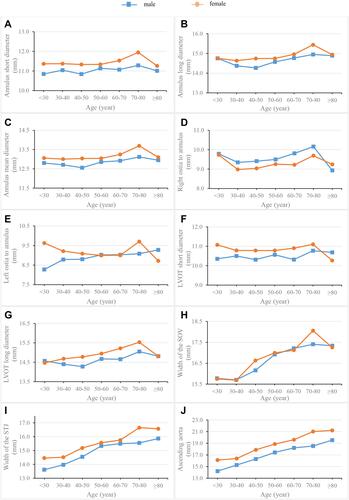
Figure 3 Trend of aortic root parameter values with age. (A) Annulus short diameter; (B) Annulus long diameter; (C) Annulus mean diameter; (D) Right ostia to annulus; (E) Left ostia to annulus; (F) LVOT short diameter; (G) LVOT long diameter; (H) Width of the SOV; (I) Width of the STJ; (J) Ascending aorta.
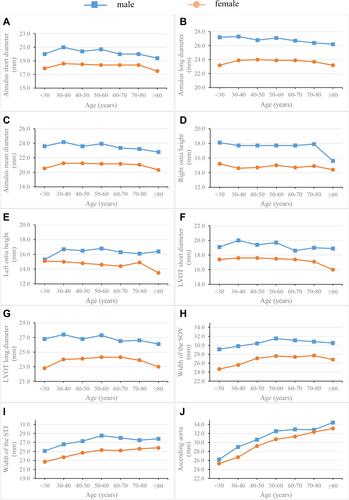
Figure 4 Trend of aortic root parameter values with age after BSA correction. (A) Annulus short diameter; (B) Annulus long diameter; (C) Annulus mean diameter; (D) Right ostia to annulus; (E) Left ostia to annulus; (F) LVOT short diameter; (G) LVOT long diameter; (H) Width of the SOV; (I) Width of the STJ; (J) Ascending aorta.