
Figures & data
Table 1 Descriptive Characteristics of the Participants
Figure 1 Anxiety level among different regions of Saudi Arabia. The y-axis shows the region, while the x-axis shows the percentages of anxiety in different regions. The green bar indicates mild anxiety, the blue bar indicates moderate anxiety, and the yellow bar indicates severe anxiety.
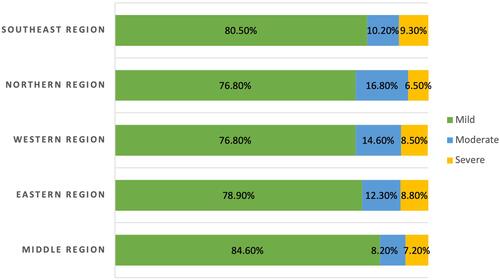
Table 2 Association of Anxiety with Participants Characteristics
Table 3 Effect of Participants Characteristics on Anxiety