
Figures & data
Figure 1 Product ion spectra of [M + H]+ of metformin, afatinib (IS), fragmentation ion scans. Y-axis is Relative intensity (cps); X-axis is mass-to-charge (m/z, Da).
![Figure 1 Product ion spectra of [M + H]+ of metformin, afatinib (IS), fragmentation ion scans. Y-axis is Relative intensity (cps); X-axis is mass-to-charge (m/z, Da).](/cms/asset/5c8aa49c-eb9f-49f3-ae6a-db50b50c2b38/dijg_a_12168074_f0001_b.jpg)
Figure 2 Mass chromatograms of blank dried blood spot (A), dried blood spot spiked with a metformin (8 µg/mL) (B) and afatinib (5µg/mL) (C) and dried blood spot from patient after 4 h after administration of 500 mg metformin (D).
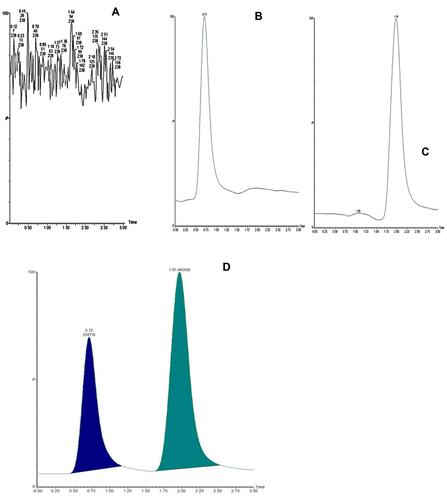
Table 1 Summary of Back Calculated of the Calibration Curve for the Determination of MET
Table 2 Extraction Recovery (ER) and Matrix Effect (ME) of QC Sample of Metformin in Spiked DBS Using LC-MS/MS
Figure 3 Stability of metformin in autosampler vials at different temperature conditions.
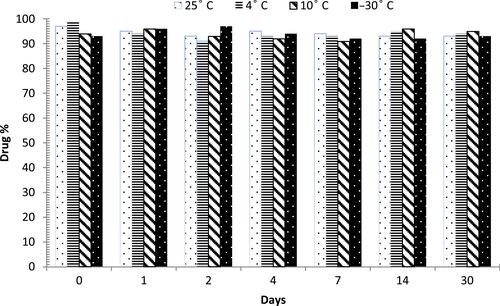
Table 3 Metformin Concentrations from Six Volunteers