
Figures & data
Figure 1 The results of reproducibility and correlation by the DxI800 and Jet-iStar3000. (A) The mean of the two measurement results by the comparison method was used as the axis X, and the mean of the two measurement results by the experimental method was used as the axis Y, plotted with a slope of 1.0 across the origin. (B) The mean of the two measurement results by the comparison method was used as the axis X, and the results of the experimental method were used as the axis Y, plotted with a slope of 1.0 across the origin.
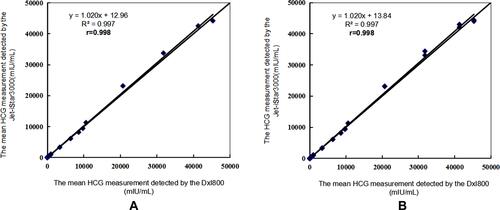
Figure 2 The scatter plot of measurement deviation by the DxI800 and Jet-iStar3000 (A) (the mean of the experimental method − the mean of the comparison method) versus (the mean of the experimental method + the mean of the comparison method)/2. (B) (the observed results of the individual experimental method − the observed results of the individual comparison method) versus (the mean of the experimental method + the mean of the comparison method)/2.
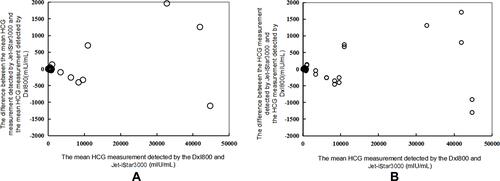
Table 1 Evaluation of the Clinical Acceptability of the HCG Results by Different Assay System (mIU/mL)