Figures & data
Figure 1 (A) The measurement method of M/S value. (B) Nodules in the figure were all NG. (C) The larger nodule in the figure was FTC.
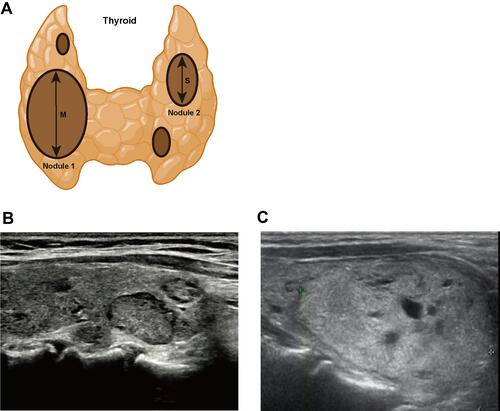
Table 1 Differential Analysis of Clinical and Ultrasonographic Features Between FTN and NG
Figure 2 The clinical and ultrasonographic characteristics of FTN and NG.
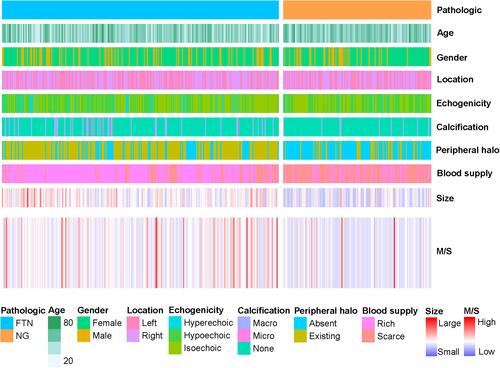
Table 2 Differential Analysis of Clinical and Ultrasonographic Features Between FTC and FA
Table 3 Differential Analysis of M/S Values Between FTN (Including FTC and FA) and NG
Figure 3 (A) Difference of M/S values in FTN and nodular goiter. (B) Difference of M/S values in FTC and FA.
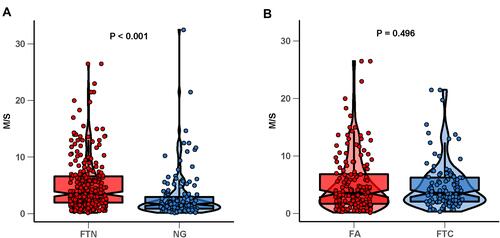
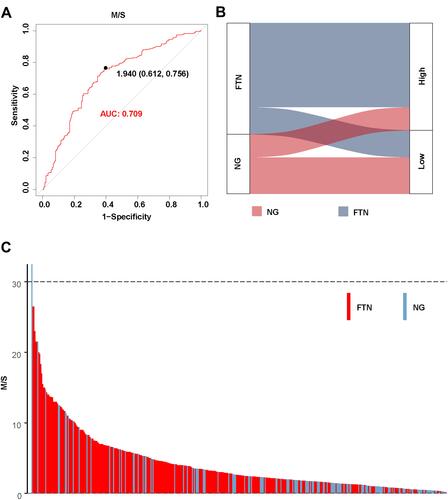
Figure 4 (A) The predictive value of M/S value in thyroid ultrasonography. (B) Corresponding relationship between two kinds of thyroid nodules with M/S value. (C) The distribution of FTN and NG with M/S values in 422 thyroid target nodules.