Figures & data
Figure 1 The expression level of KRT7 in PAAD and normal pancreas tissues. (A) The expression of KRT7 in PAAD (red) and normal pancreas tissue (gray) analyzed by GEPIA. (B) Meta-analyses of the KRT7 expression in PAAD samples analyzed by Oncomine. (C) The expression of KRT7 in various tumors analyzed by Oncomine. Red indicates high expression, and blue indicates low expression. (D) Immunohistochemical staining of KRT7 in PAAD tissues (a-c) and normal pancreas tissues (d-f) analyzed by the HPA database.
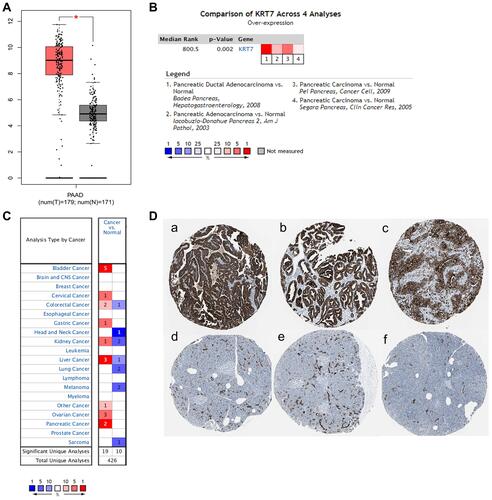
Table 1 Correlation Between KRT7 Expression and Clinicopathological Characteristics of PAAD
Table 2 Univariate and Multivariate Cox Regression Analysis of Overall Survival in PAAD Patients
Table 3 Univariate and Multivariate Cox Regression Analysis of Disease-Free Survival in PAAD Patients
Figure 2 Prognostic significance of KRT7 in PAAD. (A-B) The prognostic significance of KRT7 expression in PAAD analyzed by GEPIA. (C-D) The prognostic significance of KRT7 expression in PAAD analyzed by PROGgeneV2.
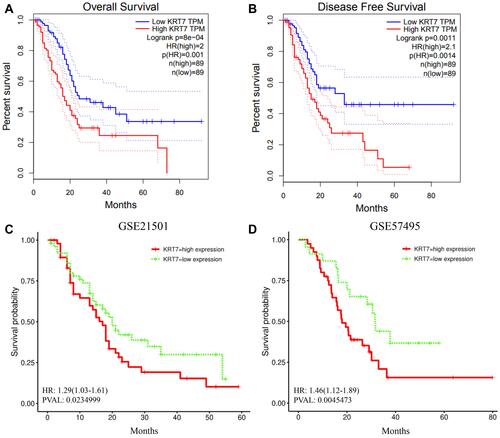
Figure 3 The relationship between KRT7 expression and tumor grade (A) and TP53 mutations (B) in PAAD analyzed by UALCAN. *P < 0.05, **P < 0.01, ***P < 0.001.
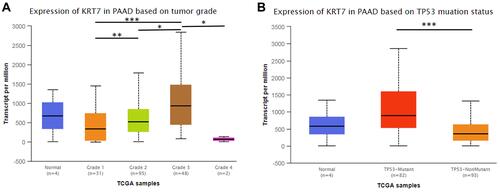
Figure 4 Analysis of the difference in immune infiltration between the high and low KRT7 expression groups analyzed by ImmuCellAI. (A) The landscape of immune infiltration levels in TCGA-PAAD samples. (B) The difference of 24 immune infiltrating cells in the high and low KRT7 expression groups in PAAD.
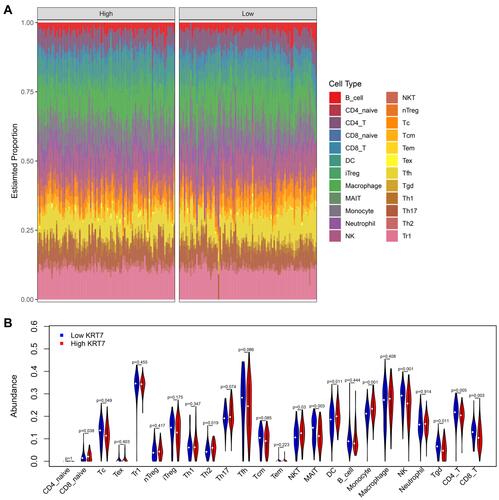
Figure 5 The correlation between KRT7 expression with immunomodulators. (A-B) The correlation between KRT7 expression with immunoinhibitors and the top 2 immunoinhibitors showing the greatest correlation with KRT7 in PAAD. (C-D) The correlation between KRT7 expression with immunostimulators and the top 2 immunostimulators showing the greatest correlation with KRT7 in PAAD.
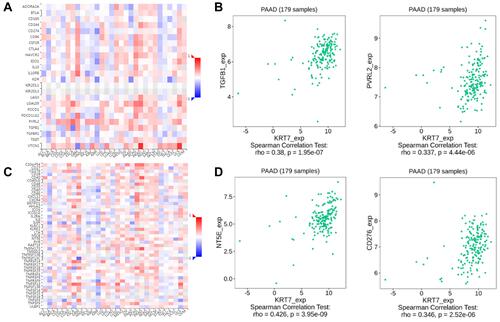
Figure 6 Genes correlated with KRT7 in PAAD analyzed by LinkedOmics. (A) All expressed genes correlated with KRT7 in PAAD. (B) Protein–protein interaction network and MCODE analysis of coexpressed genes. (C) Top 50 genes positively related to KRT7 in PAAD. (D) Top 50 genes negatively related to KRT7 in PAAD.
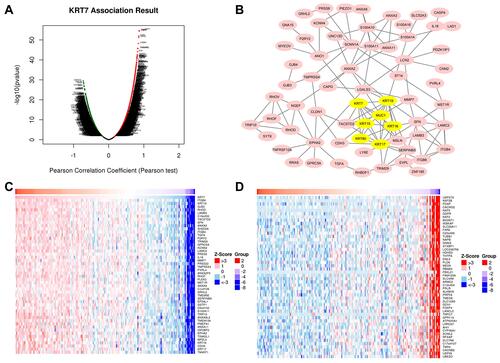
Figure 7 Survival analysis of 6 hub genes in PAAD performed by GEPIA. The results showed that KRT19, KRT16 and KRT17 were associated with the overall and disease-free survival rates in PAAD patients (P < 0.05).
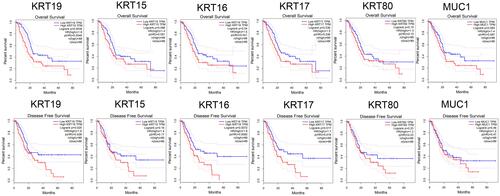
Figure 8 Significant GO and KEGG terms of the coexpressed genes. (A) Biological process analysis of the coexpressed genes. (B) Cell component analysis of the coexpressed genes. (C) Molecular function analysis of the coexpressed genes. (D) KEGG pathway analysis of the coexpressed genes.
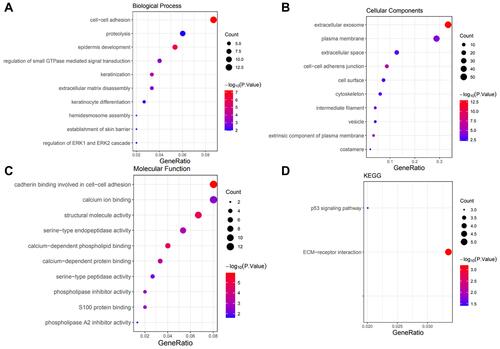
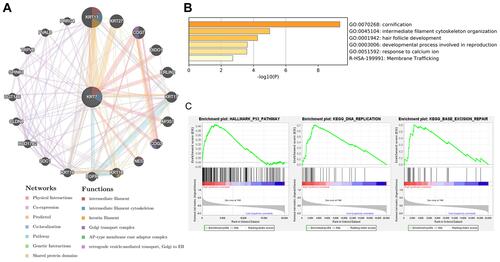
Figure 9 The biological functions of KRT7 and its related genes. (A) Protein–protein interaction network of KRT7 and its related genes analyzed by GeneMANIA. (B) Functional enrichment pathways of KRT7 and its related genes analyzed by Metascape. (C) Significant pathways in the data sets of high KRT7 expression analyzed by GSEA.