Figures & data
Figure 1 Weighted gene co-expression network analysis. (A) Venn diagram of immune-related and all genes in the GSE53963 dataset. (B) Scale-free fit index for soft-thresholding powers. (C) Dendrogram of all differentially expressed genes, clustered based on different metrics. (D) Heatmap of the correlation between module eigengenes and clinical traits. (E) Correlation and significance of the red and yellow modules with stage of OSCC or overall survival (OS) of OSCC patients, respectively.
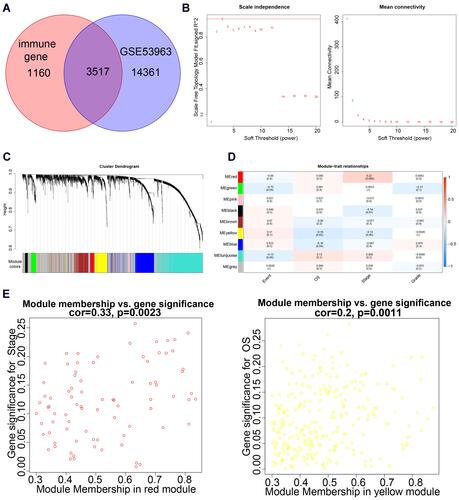
Table 1 Immune-Related Genes in the GSE53963 Dataset
Figure 2 Construction of the immune-related prognostic signature for ovarian serous cystadenocarcinoma. (A) Determination of the six model characteristic genes by least absolute shrinkage and selection operator analysis. (B) Time-dependent receiver operating characteristic (tROC) curves to evaluate the ability of the signature index to predict 2-year and 5-year survival in the GSE53963 dataset. (C and D) Survival probability in the GSE53963 and The Cancer Genome Atlas datasets. (E) Forest plot of the signature index.
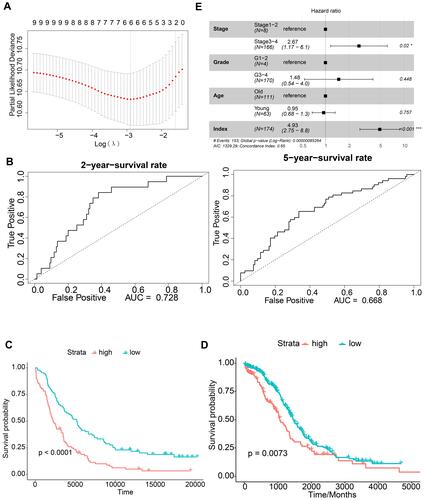
Figure 3 Immunohistochemical analysis. Expression of immune-related signature genes in normal ovarian and ovarian cancer tissues explored using the Human Protein Atlas database.
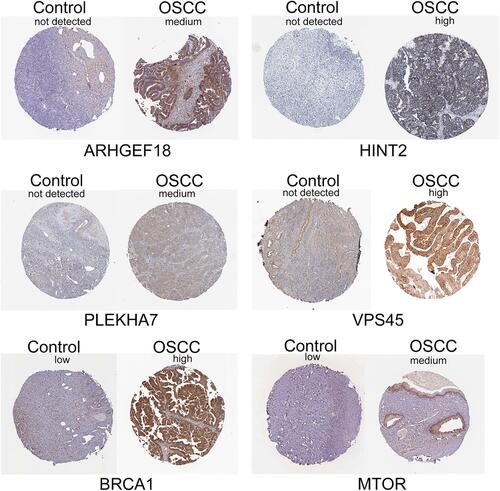
Figure 4 Gene set enrichment analysis. (A and C) Biological processes and (B and D) Kyoto Encyclopedia of Genes and Genomes pathways enriched in the (A and B) GSE53963 and (C and D) The Cancer Genome Atlas datasets.
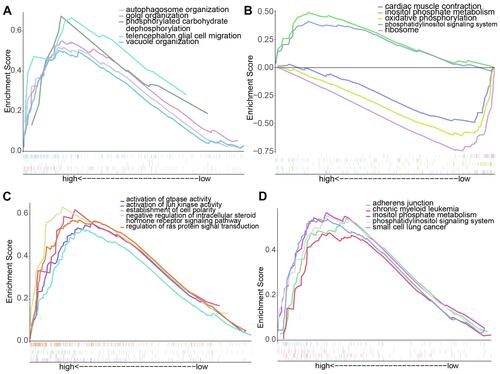
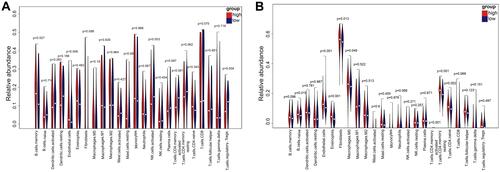
Figure 5 Abundance of immune cells in ovarian serous cystadenocarcinoma patients in the (A) GSE53963 and (B) The Cancer Genome Atlas datasets. Relative abundance was determined indirectly from the expression level of marker genes corresponding to each type of immune cell.