
Figures & data
Table 1 Characteristics and Events of AA Patients
Figure 1 (A) 5-year OS was 85.7% ± 4.0% in all patients who underwent IST; and (B) the event-free survival rate was 76.0% ± 4.6% in the medium 50.6-month follow up.
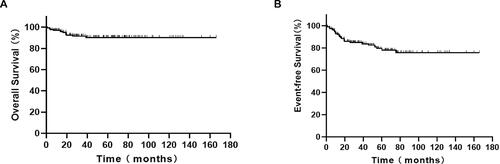
Figure 2 (A) The 5-year OS rates in patients with NSAA, SAA, and VSAA were 100%, 90.5% ± 4.1%, and 84.0% ± 6.0%, respectively; and (B) the event-free survival rates in patients with NSAA, SAA, and VSAA were 94.4% ± 5.4%, 71.2% ± 7.1%, and 71.0% ± 9.6%, respectively.
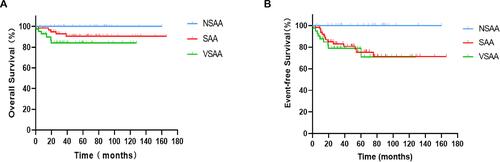
Table 2 Different Time Point for Evaluation of IST
Table 3 Comparison of Clinical Features and Lab Data Between Response and Non-Response Groups
Table 4 Receiver Operating Characteristic Curve Analysis, Optimum Cutoff Value and Predict Performance for Factors Affecting Overall Response to IST
Figure 3 The ROC curve analyzed the correlations of the RBC count, Hb level, and PLT count with the patient IST response.
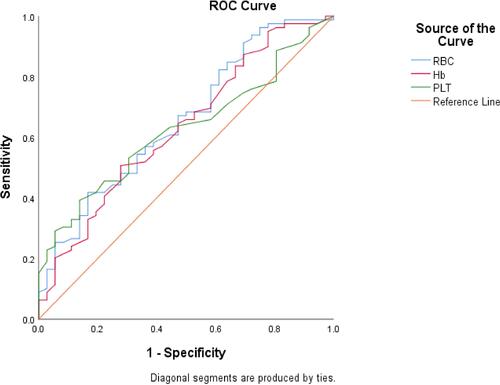
Table 5 Contributing Factors for Overall Response to IST: Univariate Analysis
Table 6 Contributing Factors for Overall Response to IST: Multivariate Logistic Regression Analysis (Backward, Wald, α = 0.05)