
Figures & data
Table 1 Baseline Characteristics of Critically Ill Patients with AUD
Table 2 Baseline Characteristics of the Study Population with Different Lactate Level
Figure 1 The relationship between lactate and 30-day mortality in critically ill patients with AUD. The dotted lines on both sides represent 95% confidence interval.
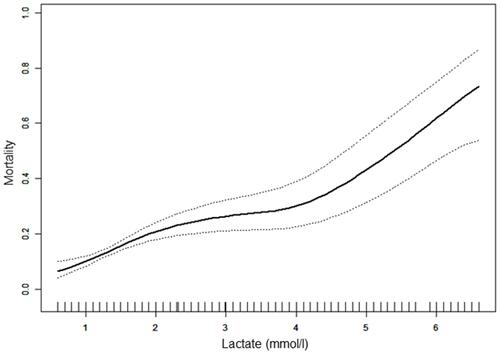
Table 3 The Association Between Lactate and 30-Day Mortality
Figure 2 ROC curves for the prediction of mortality in critically ill patients with AUD. The area under curve of lactate, SOFA and SAPS-II were 0.672, 0.7413, and 0.7883 respectively.
Abbreviations: SOFA, sequential organ failure assessment; SAPS-II, simplified acute physiology score II.
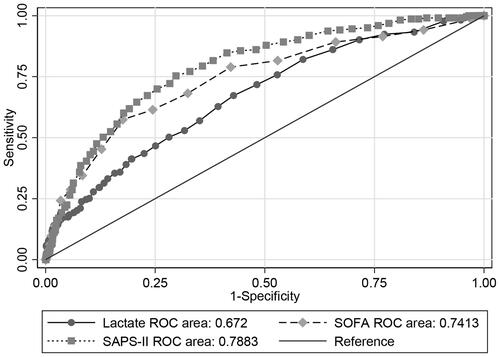
Table 4 Subgroup Analysis of the Associations Between Lactate and 30-Day All-Cause Mortality