Figures & data
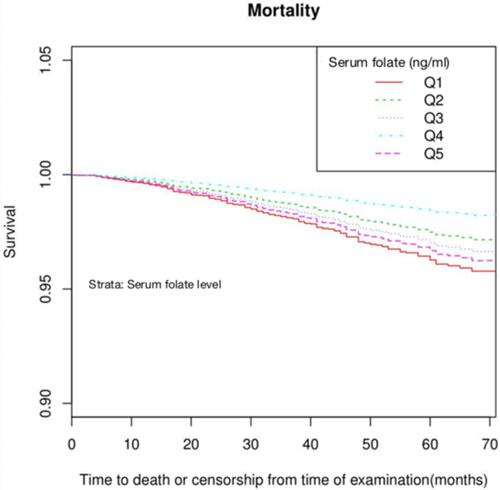
Figure 1 Flowchart of participation selection.
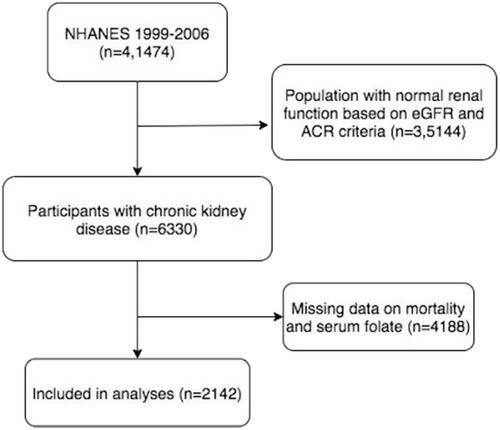
Table 1 Baseline Characteristic of the Study Participants with Chronic Kidney Disease (n=2142)
Table 2 Multivariate Analysis of Serum Folate Levels Associated with All-Cause Mortality
Table 3 Threshold Effect Analysis of Serum Folate on Mortality Using Piece-Wise Linear Regression Model
Figure 2 Adjusted restricted cubic spline plots for all-cause mortality and serum folate concentrations. The potential confounders adjusted were as follows: age, sex, race, hypertension, physical activity, body mass index, eGFR, serum vitamin B12, albumin, serum glucose, phosphorus, uric acid, total iron binding capacity, folate as dietary folate equivalents, food folate.
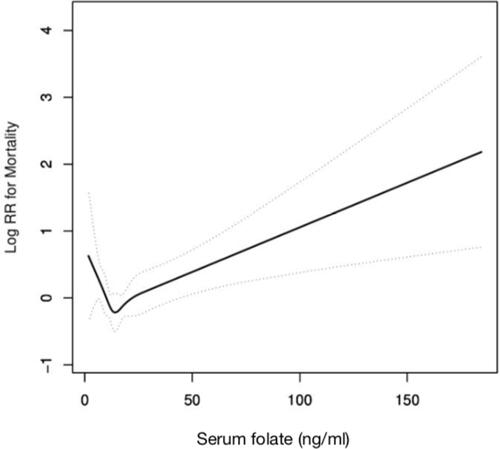
Figure 3 Survival probability by the level of serum folate. Quintile categories of serum folate: Q1<8.7ng/mL, Q2 8.7–11.4ng/mL, Q3 11.5–14.6ng/mL, Q4 14.7–19.1ng/mL, Q5 ≥19.2ng/mL. The potential confounders adjusted were as the same as .