Figures & data
Table 1 The General Characteristics and Serum Index
Table 2 The Ultrasonographic Parameters
Table 3 Local Energy Loss in the Left Ventricle During P1 [J/(S·m3)]
Table 4 Local Energy Loss in the Left Ventricle During P2 [J/(S·m3)]
Table 5 Local Energy Loss in the Left Ventricle During P3 [J/(S·m3)]
Table 6 Local Energy Loss in the Left Ventricle During P4 [J/(S m3)]
Figure 1 Comparison of changes among three groups during the same phase at different segments of the left ventricle. (A) Rapid filling phase (P1); (B) slow filling phase (P2); (C) atrial contraction phase (P3); (D) rapid ejection phase (P4); base: the base segment; middle: the middle segment; apex: the apical segment.
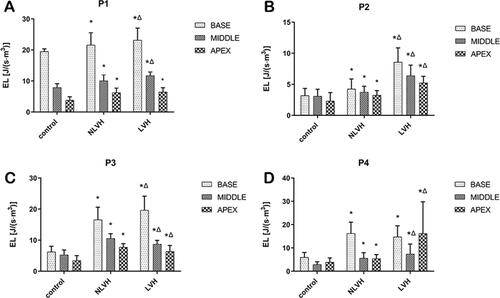
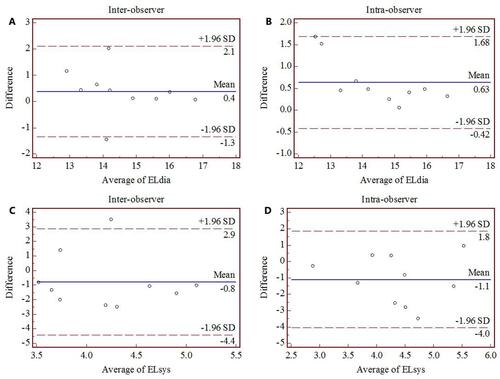
Figure 2 Repeatability test for the diastolic and systolic energy loss of the left ventricle in normal subjects; (A and C) the inter-observer repeatability test, with the correlation coefficient of 0.9745 and 0.9887, respectively; (B and D) the intra-observer repeatability test, with the correlation coefficient of 0.9585 and 0.9413, respectively.