Figures & data
Table 1 MYCN Gene Expression Detected by FISH and c-MYC Protein Expression by IHC in NTs
Figure 1 MYCN gene expression detected by FISH and c-MYC protein expression by IHC in NTs. (A) MYCN amplification, FISH, original magnification × 1000. MYCN (red signal) clustering occurred. (B) Lack of MYCN amplification, FISH, original magnification × 1000. The ratio of MYCN (red signal) to LAF (green signal) was ≤1.0. (C) Positive (+) c-MYC expression, immunostaining, original magnification × 400. (D) Negative (-) c-MYC expression, immunostaining, original magnification × 400.
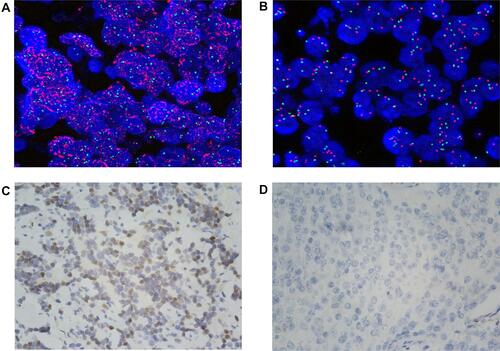
Table 2 Association of MYCN Amplification and c-MYC Expression with the Shimada Classification
Table 3 Association of MYCN Amplification and Positive c-MYC Expression with Morphological Changes
Figure 2 Morphological changes of NTs. HE staining, original magnification × 400. (A) Bull’s eye cells (indicated by arrows). (B) Nuclear inclusions (indicated by arrows). (C) Calcification (indicated by arrows). (D) Lymphocyte clustering (indicated by arrows).
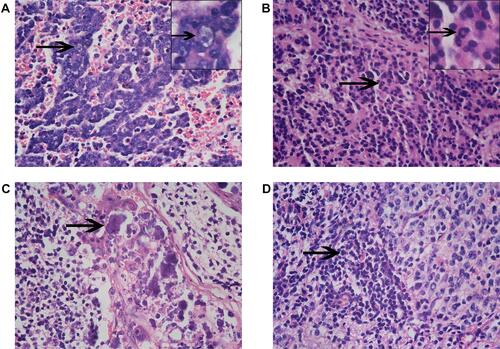
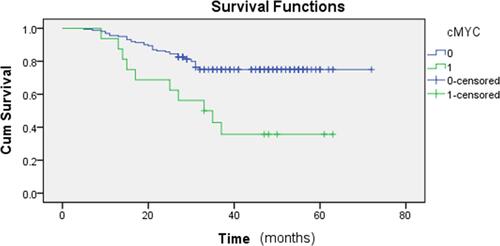
Table 4 Association of MYCN Amplification and c-MYC Expression with the 3-Year Survival Rate in Patients with NTs
Figure 3 Kaplan-Meier curves and Log rank tests. The results showed that there was a significant difference in survival rate between the c-myc positive and negative groups (P=0.001).